Live DCA Pressure Analysis
Track DCA order activity across Solana to spot systematic buy and sell pressure before it moves price.
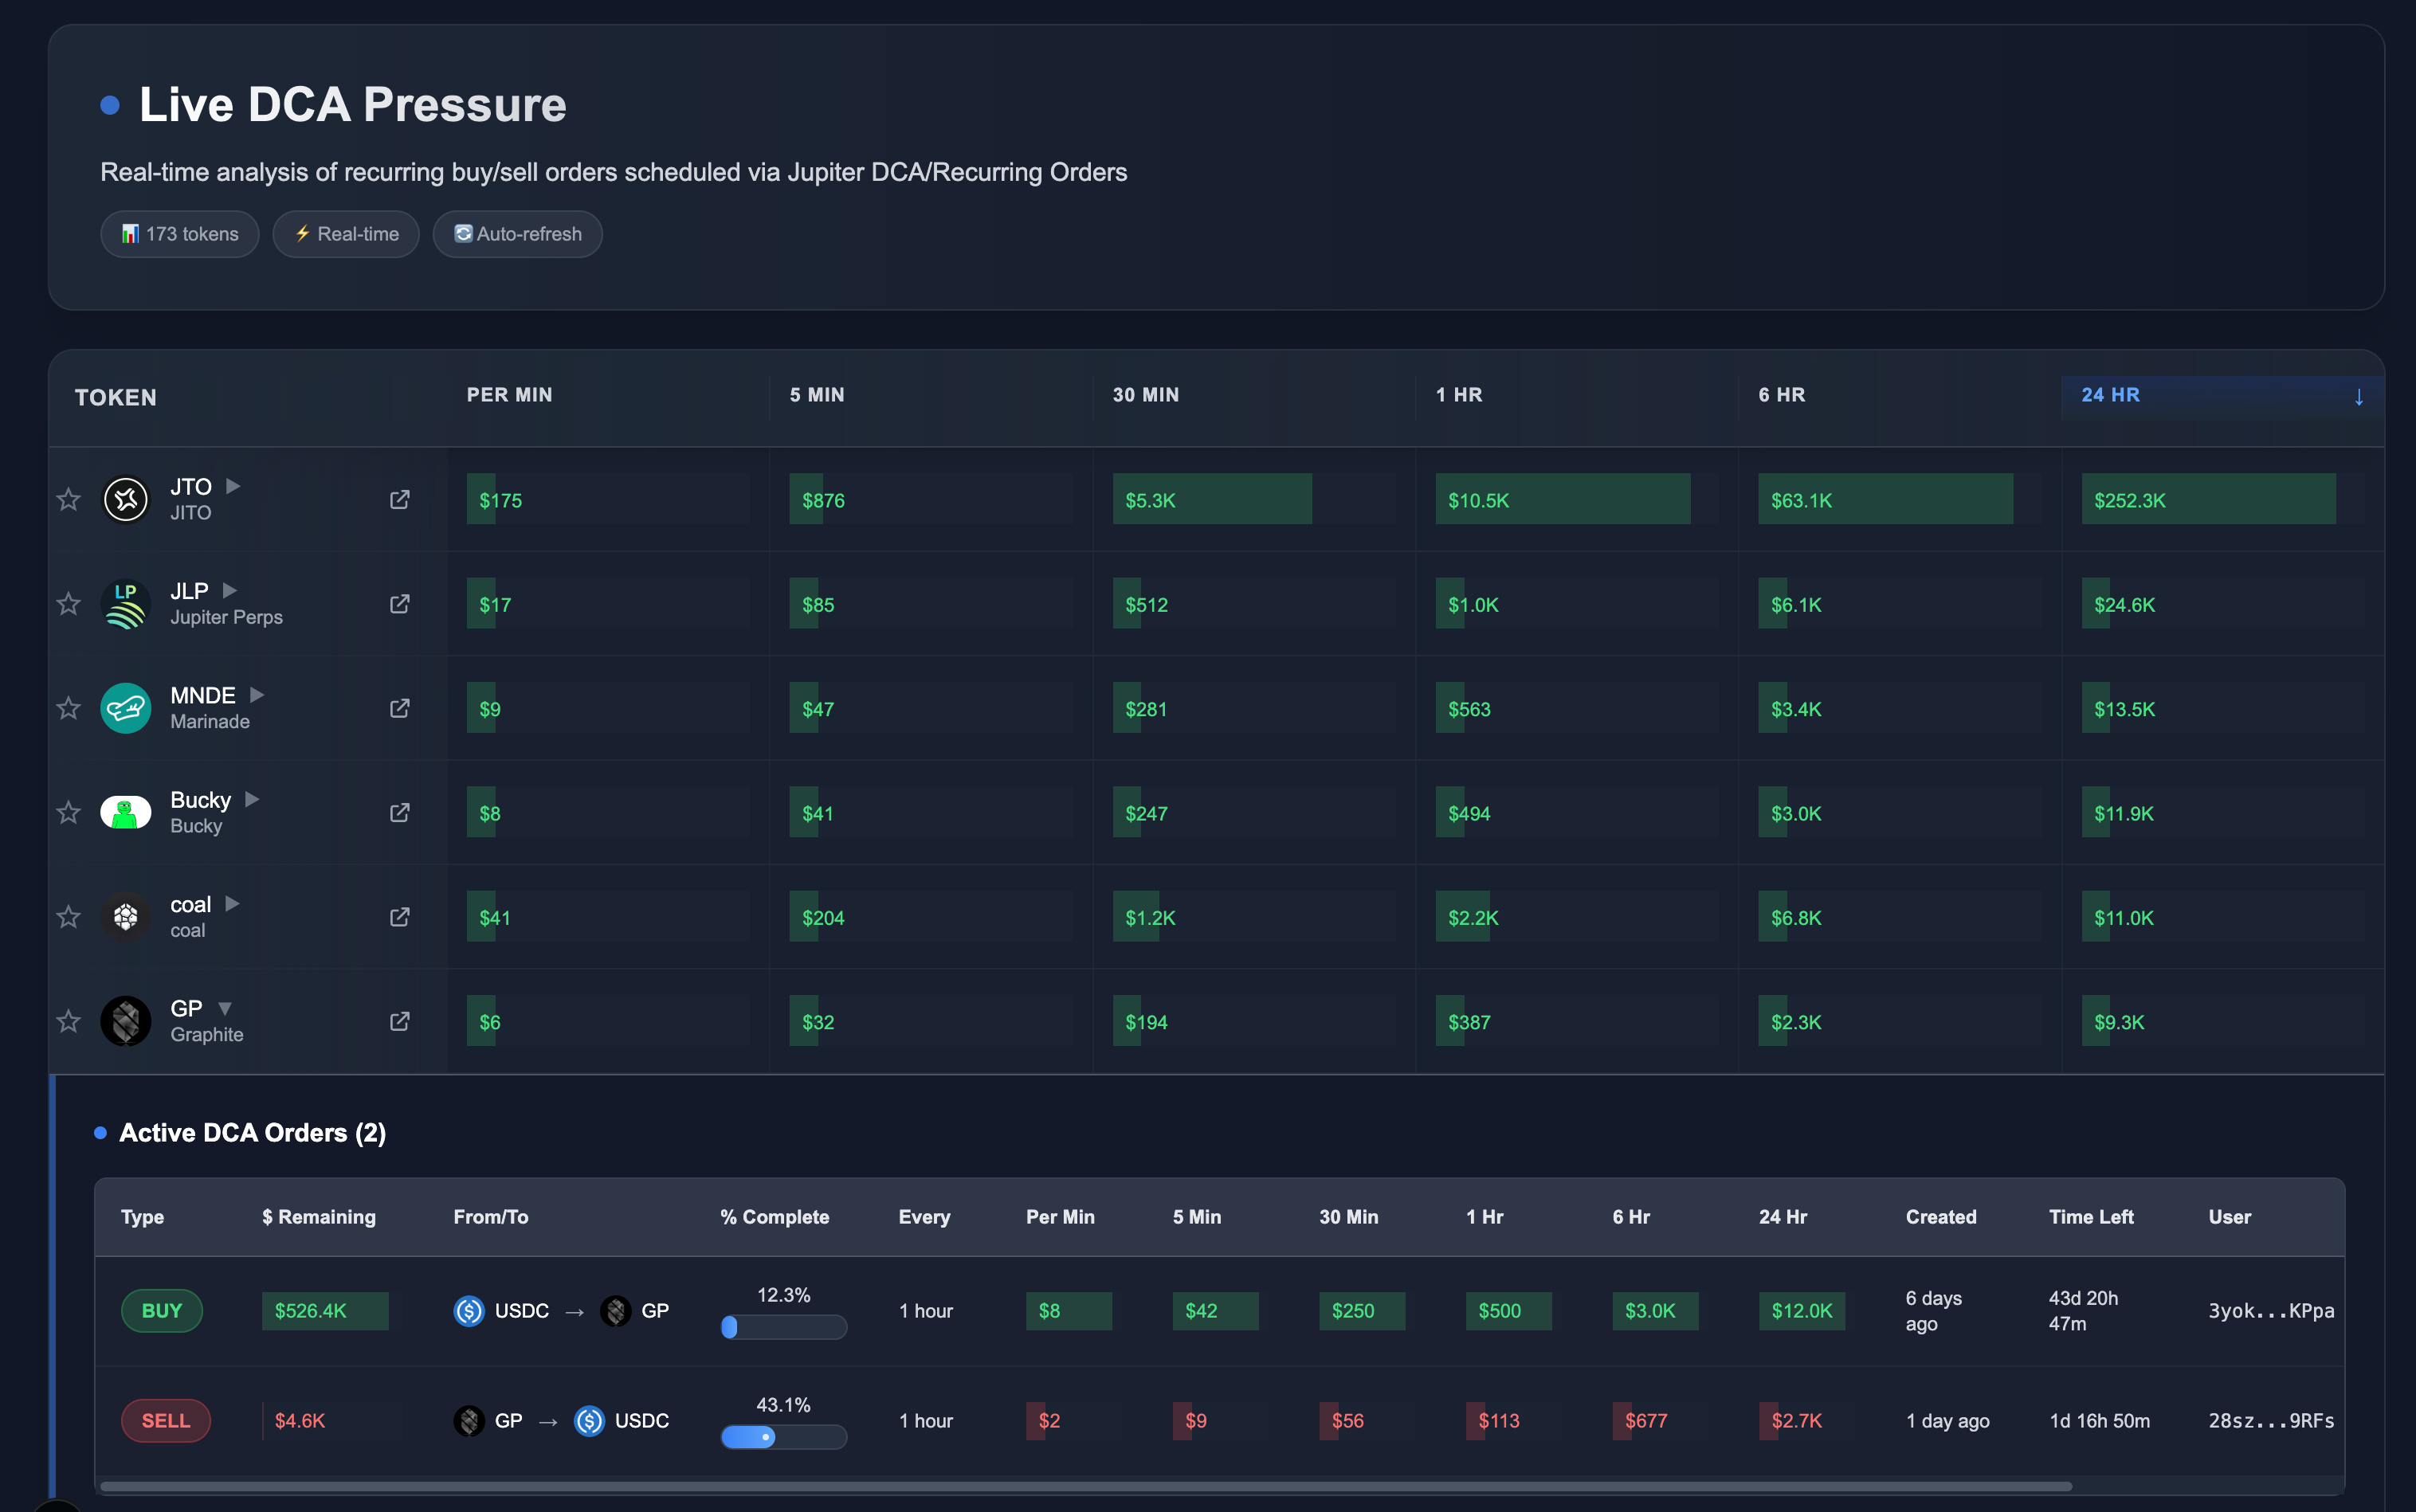
Live DCA Pressure Dashboard
See which tokens have active DCA buy or sell orders. DCA orders execute on a schedule regardless of price, so they create predictable pressure.
Key Features
- Multi-Timeframe Analysis: View DCA order impact across 5min, 30min, 1hr, 6hr, and 24hr windows
- Projected Price Impact % (Premium): Toggle between absolute dollar values and percentage-based price impact projections. Quickly size up incoming order flow relative to available liquidity and sort by impact % for your target time frame
- Auto-refresh: Data updates automatically so you're always looking at current order activity
- Order Details: Click any DCA order to view detailed information including progress, remaining amounts, cycle frequency, and time-range impact
- Direction Indicators: Buy pressure shows green, sell pressure shows red
Good for spotting tokens with sustained buying or selling activity that hasn't shown up in price yet.
Understanding DCA Orders
DCA orders buy or sell on a fixed schedule regardless of price. Unlike limit orders (which wait for a price) or concentrated liquidity (which sits passively), DCA orders actively execute at regular intervals.
How DCA Orders Create Market Pressure
- Scheduled execution: They fire at set intervals (every hour, every 4 hours, etc.), creating steady pressure in one direction
- Price-agnostic: They don't wait for a specific price. They just execute on schedule.
- Accumulation/distribution signal: Large DCA buys often mean smart money is accumulating. DCA sells can signal planned distribution.
- Directional force: They push price in a direction over time, rather than providing resistance at a fixed level
Projected Price Impact % (Premium Feature)
Premium subscribers can toggle to show projected price impact % instead of dollar values. This shows expected price movement from DCA orders relative to current liquidity.
Why It Matters
- A $10K DCA order hits very differently on SOL (deep liquidity) vs. a small-cap token (thin liquidity). Impact % shows the actual expected price effect.
- Sort by impact to find tokens with the highest projected price movement in your trading timeframe (5min, 30min, 1hr, 6hr, 24hr)
- For short-term trades, see what's coming in minutes to hours and how hard it'll push price
- LPs can set ranges with more confidence when they know volume is coming, how much, and for how long
How to Use Impact View
- Click the "Impact %" toggle at the top of the DCA Pressure page
- All dollar columns convert to percentage-based price impact projections
- Sort by any time frame to see which tokens have the highest expected price movement in that period
- Hover over impact values to see the underlying dollar amounts
- Green percentages show upward price pressure (buy orders), red shows downward pressure (sell orders)
Impact percentages are calculated by aggregating order depth across ALL Solana DEXs and projecting how DCA order flow will move price given current liquidity curves.
Reading the DCA Pressure Dashboard
A sortable table of tokens with active DCA orders, broken down by expected volume across multiple timeframes.
Column Reference
- Per Min: Average DCA order volume executing per minute (or price impact per minute in Impact % view)
- 5 Min: Expected volume in next 5 minutes - useful for very short-term price action
- 30 Min: Expected volume in next 30 minutes - relevant for intraday trading
- 1 HR: Expected volume in next hour - standard timeframe for active trading
- 6 HR: Expected volume in next 6 hours - medium-term pressure indicator
- 24 HR: Expected volume in next 24 hours - full day accumulated pressure
Green = buy pressure. Red = sell pressure. In absolute view, bigger dollar amounts mean more volume. In impact view, bigger percentages mean more expected price movement.
Trading Strategies Using DCA Pressure
Basic Strategies
- Trend confirmation: DCA buy pressure aligned with upward price movement backs up bullish momentum
- Early accumulation: Large DCA buys appearing before any price move can signal smart money getting in
- Distribution warnings: Rising DCA sell pressure, especially from large orders, often precedes price declines
- Countertrend plays: DCA buy pressure during dips suggests strong hands accumulating at a discount
- Timing entries/exits: Use different timeframe columns to plan around expected pressure
Advanced Impact % Strategies (Premium)
- Liquidity-normalized sorting: Sort by impact % to find where incoming orders will move price the most, regardless of market cap. A 2% projected impact is significant even if the order is "only" $5K on a low-liquidity token.
- Scalping: Use 5min and 30min impact columns for immediate opportunities. Token showing +3% impact in next 5min from DCA buys? Consider front-running the pressure with a quick long.
- Swing positioning: Sort by 6hr or 24hr impact for medium-term directional plays. Tokens with sustained +10%+ impact over 24hrs from DCA buying may set up multi-hour or multi-day bullish runs.
- LP range setting: If DCA pressure projects +5% movement in 1hr, set your LP range to capture that expected action.
- Position sizing: Tokens with high impact % from DCA orders are more directionally predictable. Size up when the DCA pressure signal is clear.
Inspecting Individual DCA Orders
Click on any row in the DCA Pressure table to expand and view individual DCA orders for that token. Each order shows:
- Order Type: BUY or SELL direction
- Remaining Amount: How much capital is left to be deployed
- Token Pair: What tokens are being exchanged (e.g., USDC → TOKEN or TOKEN → SOL)
- Progress: Percentage of the order already executed
- Cycle Frequency: How often the order executes (e.g., every 1 hour)
- Time-Range Impact: Expected volume across 5min, 30min, 1hr, 6hr, and 24hr windows
- Created & Time Left: When the order was created and how long until completion
Best Practices
- Watch for sudden changes in DCA pressure over time - that often signals a shift in who's positioning and how
- Compare DCA pressure to actual price movement - divergences can indicate manipulation or whale activity
- Use the per-minute column to identify tokens with the most immediate pressure
- Cross-reference DCA pressure with token liquidity depth charts to understand total market structure
- Pay attention to order creation times - newly created large DCA orders may signal important upcoming events