What is CLOBr?
Learn about CLOBr, a powerful tool that aggregates liquidity data from Solana DEXs to improve your trading decisions.
Introducing CLOBr
CLOBr (Concetrated Liquidity Order Book Aggregator) is a specialized tool designed to aggregate and visualize liquidity data from all major Solana decentralized exchanges. By collecting data from concentrated liquidity positions, limit orders, and DCA orders across the ecosystem, CLOBr provides traders with a comprehensive view of market structure that isn't available through any single platform.

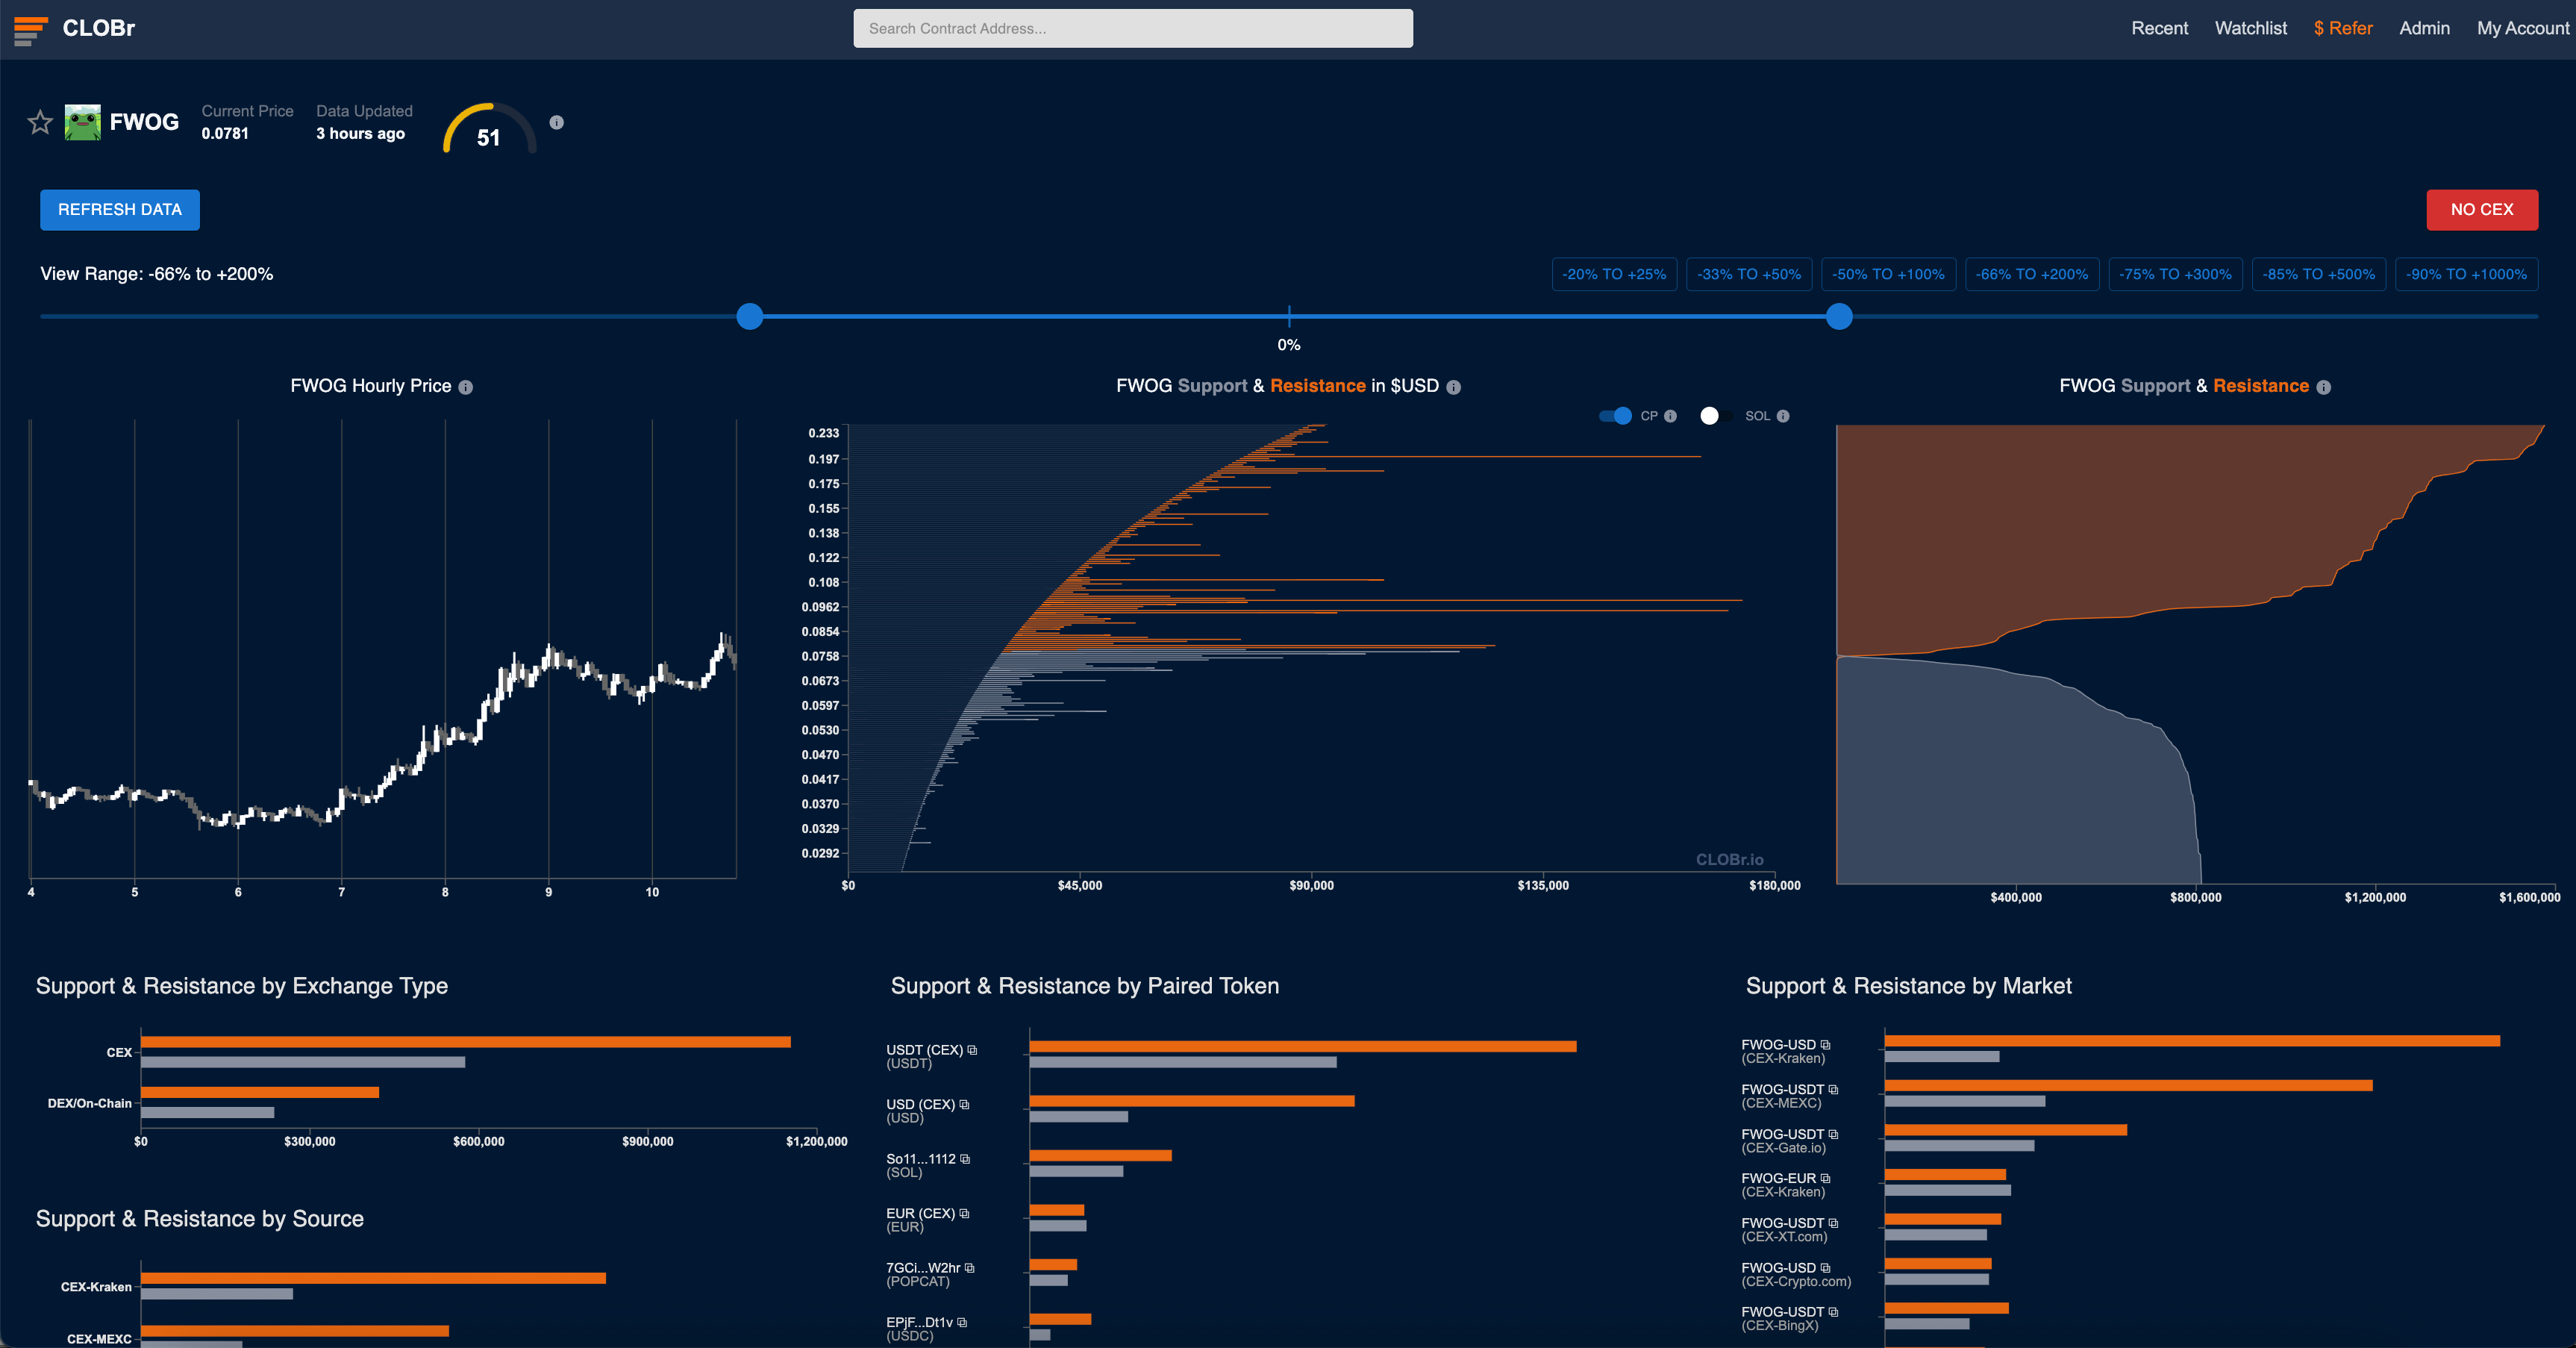
CLOBr main interface
The Problem CLOBr Solves
In traditional finance and centralized exchanges, traders rely on order books to identify support and resistance levels. These order books show where buyers and sellers have placed their orders, helping traders understand market sentiment and potential price action.
In DeFi, however, liquidity is fragmented across:
- Multiple DEXs (Raydium, Orca, Meteora, etc.)
- Different liquidity mechanisms (pools, concentrated liquidity, limit orders)
- Various trading platforms and aggregators
This fragmentation makes it nearly impossible for traders to manually track where significant liquidity exists. Without this information, traders are essentially making decisions with incomplete data about potential support and resistance levels.
Key Challenges in DeFi Trading
- Liquidity Fragmentation: Capital spread across multiple platforms
- Limited Visibility: No single source shows complete market structure
- Complex Mechanisms: Different liquidity types work in different ways
- Data Processing: Raw on-chain data is difficult to interpret
- Meaningful Aggregation: Combining diverse data sources in a coherent way
How CLOBr Changes DeFi Trading
CLOBr transforms DeFi trading by providing a unified view of liquidity across the Solana ecosystem. This comprehensive visualization allows traders to:
Identify Support and Resistance
CLOBr reveals significant buy and sell walls that aren't visible through price action alone. These walls often indicate levels where price movement may slow, reverse, or accelerate, giving traders crucial information for entry and exit decisions.
Understand Market Structure
Beyond individual walls, CLOBr helps traders visualize the entire liquidity landscape, identifying areas of concentrated interest, liquidity gaps, and potential price movement corridors based on actual capital deployment.
Improve Risk Management
By identifying where significant liquidity exists or is absent, traders can make more informed decisions about position sizing, stop loss placement, and take profit targets. Understanding potential price impact becomes much clearer.
Find Trading Opportunities
CLOBr reveals unique setups where price action interacts with liquidity walls, creating specific trading opportunities like buying above support walls, selling below resistance, or targeting liquidity gaps for breakout trades.
CLOBr's Data Sources
CLOBr aggregates data from multiple sources to create its comprehensive liquidity visualization:
Source Type | Platforms | Significance |
---|---|---|
Concentrated Liquidity | Raydium, Orca, Meteora Concentrated Pools | Forms major support/resistance walls |
Limit Orders | Jupiter | Creates precise price points of interest |
DCA Orders | Jupiter | Shows systematic buying and selling pressure |
Constant Product Pools | Raydium, Orca, Meteora, Pumpfun, Fluxbeam | Used for calculating the material price impact of the concentrated liquidity |
Centralized Exchanges | OKX, Binance, Bybit, Coinbase, etc. | For listed tokens, we show the order book from the top CEXs |
Who Benefits from CLOBr?
Different Trader Profiles
Spot Traders
Identify optimal entry and exit points based on liquidity walls, improving trade timing and risk management.
Swing Traders
Understand medium-term market structure to position for larger moves between major support and resistance levels.
Liquidity Providers
Identify underserved price ranges with less competition for concentrated liquidity positions.
Perpetual Futures Traders
Use spot market liquidity information to inform leveraged positions in derivative markets.
Arbitrageurs
Spot opportunities where price divergence might occur due to liquidity imbalances across platforms.
CLOBr vs. Traditional Tools
Unlike traditional trading tools that focus primarily on price action, CLOBr provides an additional dimension of market information by revealing the underlying liquidity structure that drives price movements.
Aspect | Traditional Chart Tools | CLOBr |
---|---|---|
Focus | Price history and patterns | Actual liquidity distribution |
Support/Resistance | Based on historical price levels | Based on current capital deployment |
Market Prediction | Pattern recognition and indicators | Actual capital committed at price levels |
Data Type | Reactive (past price action) | Proactive (current liquidity placement) |
The CLOBr Advantage
The true power of CLOBr comes from its ability to reveal information that is:
- Actionable: Directly indicates where significant buying and selling pressure exists
- Comprehensive: Aggregates data across the entire Solana DeFi ecosystem
- Forward-looking: Shows where capital is positioned to act in the future
- Objective: Based on actual on-chain data rather than subjective pattern interpretation
By combining CLOBr's liquidity insights with traditional technical analysis, traders can develop a more complete understanding of market conditions and make better-informed decisions.
In the next section, we'll explore exactly how CLOBr works to gather, process, and visualize this valuable liquidity data.