Token Detail Pages
CLOBr Score, liquidity heatmap, and token stats.
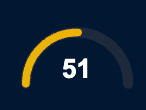
CLOBr Score (0-100 Scale)
The CLOBr Score ranges from 0 (heavy resistance above) to 100 (heavy support below). A score of 50 means liquidity is roughly balanced above and below the current price.
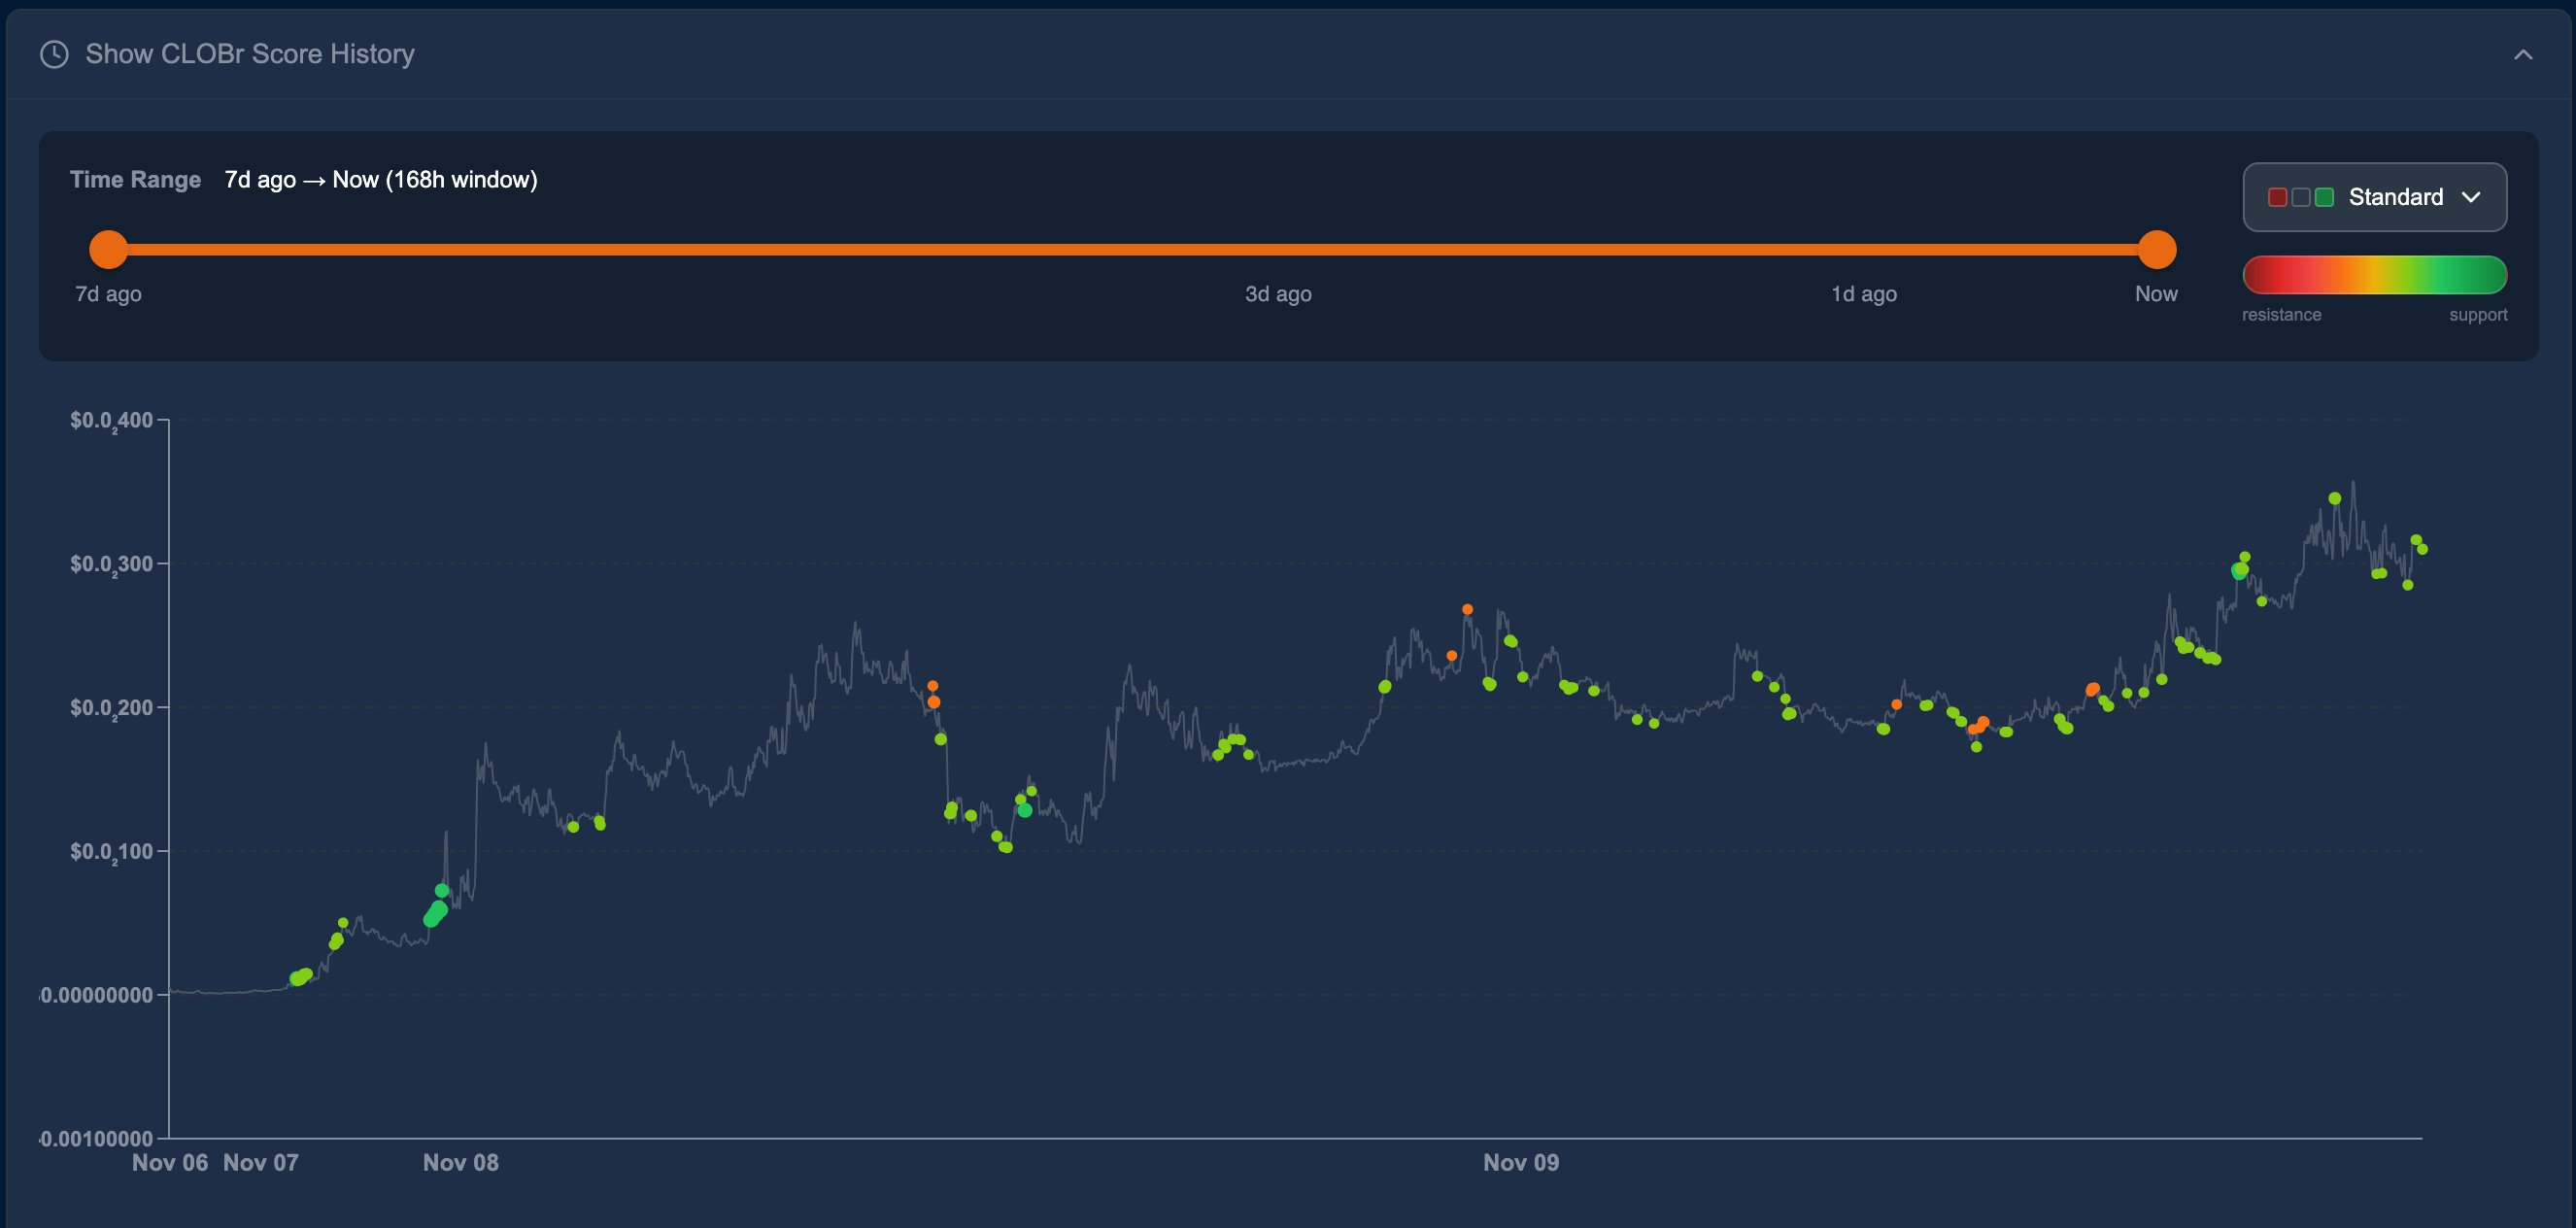
Score Trends & Price Movement
Historical scores show how liquidity conditions looked before price moved. High scores often precede bounces. Low scores often precede rejections.
Historical Score Analysis
Past CLOBr scores overlaid on the price chart so you can see how liquidity conditions lined up with price action.
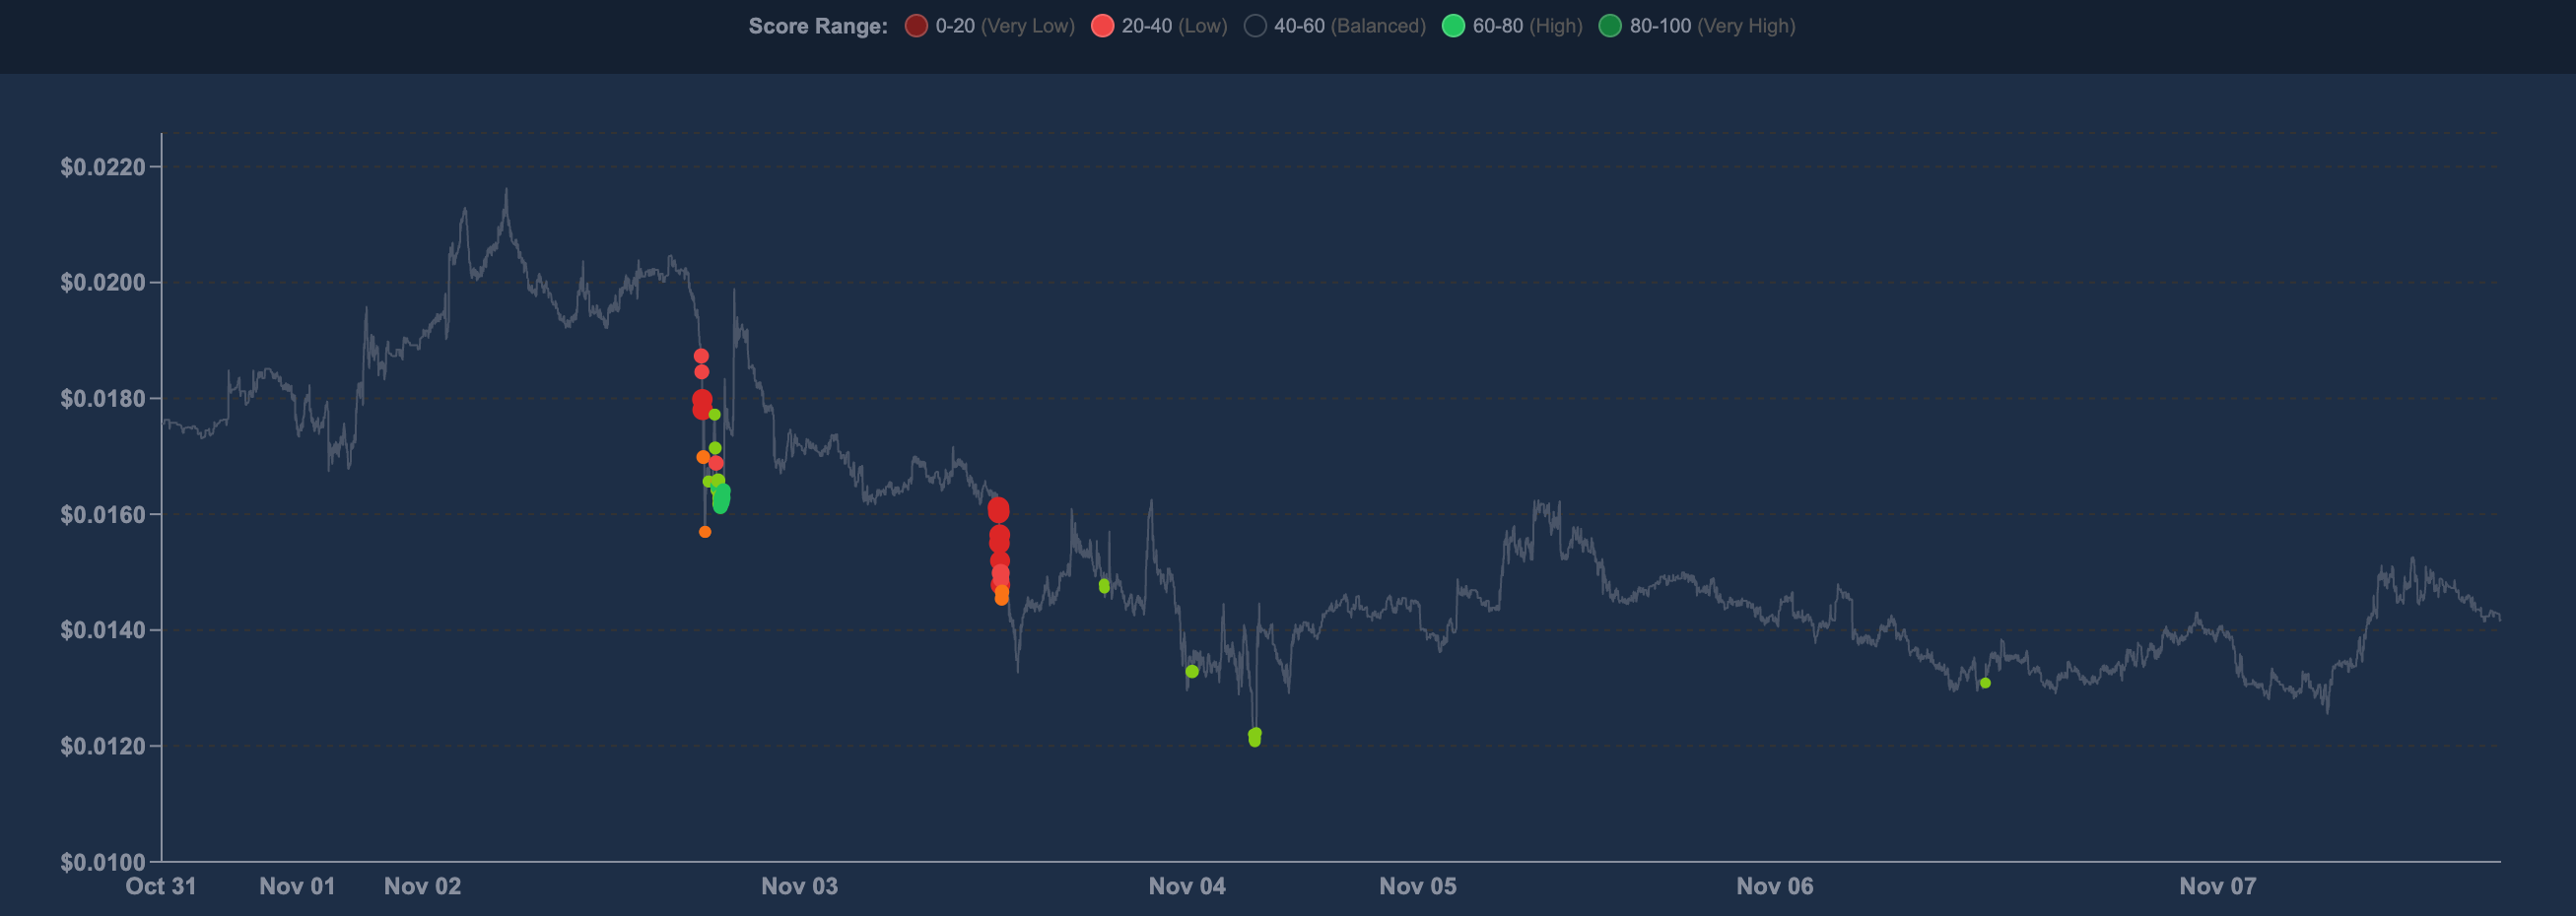
Reading the Score Trends
- High Scores (80-100, Green): Strong support below current price. Price dipping into high-score zones often finds buying pressure and bounces. Green clusters can mark entry points during pullbacks.
- Low Scores (0-20, Red): Heavy resistance above current price. Rallies into low-score zones tend to stall. Red clusters often mark local tops.
- Balanced Scores (40-60, Yellow/Orange): Roughly equal support and resistance. These transition zones often precede volatility as price searches for the next liquidity zone.
- Score Trends Over Time: Scores moving from red to yellow to green means support is building. The reverse means it's weakening.
Liquidity Heatmap
The Liquidity Heatmap shows support and resistance levels over time. You can see how liquidity was distributed at each price level throughout the chart's history.
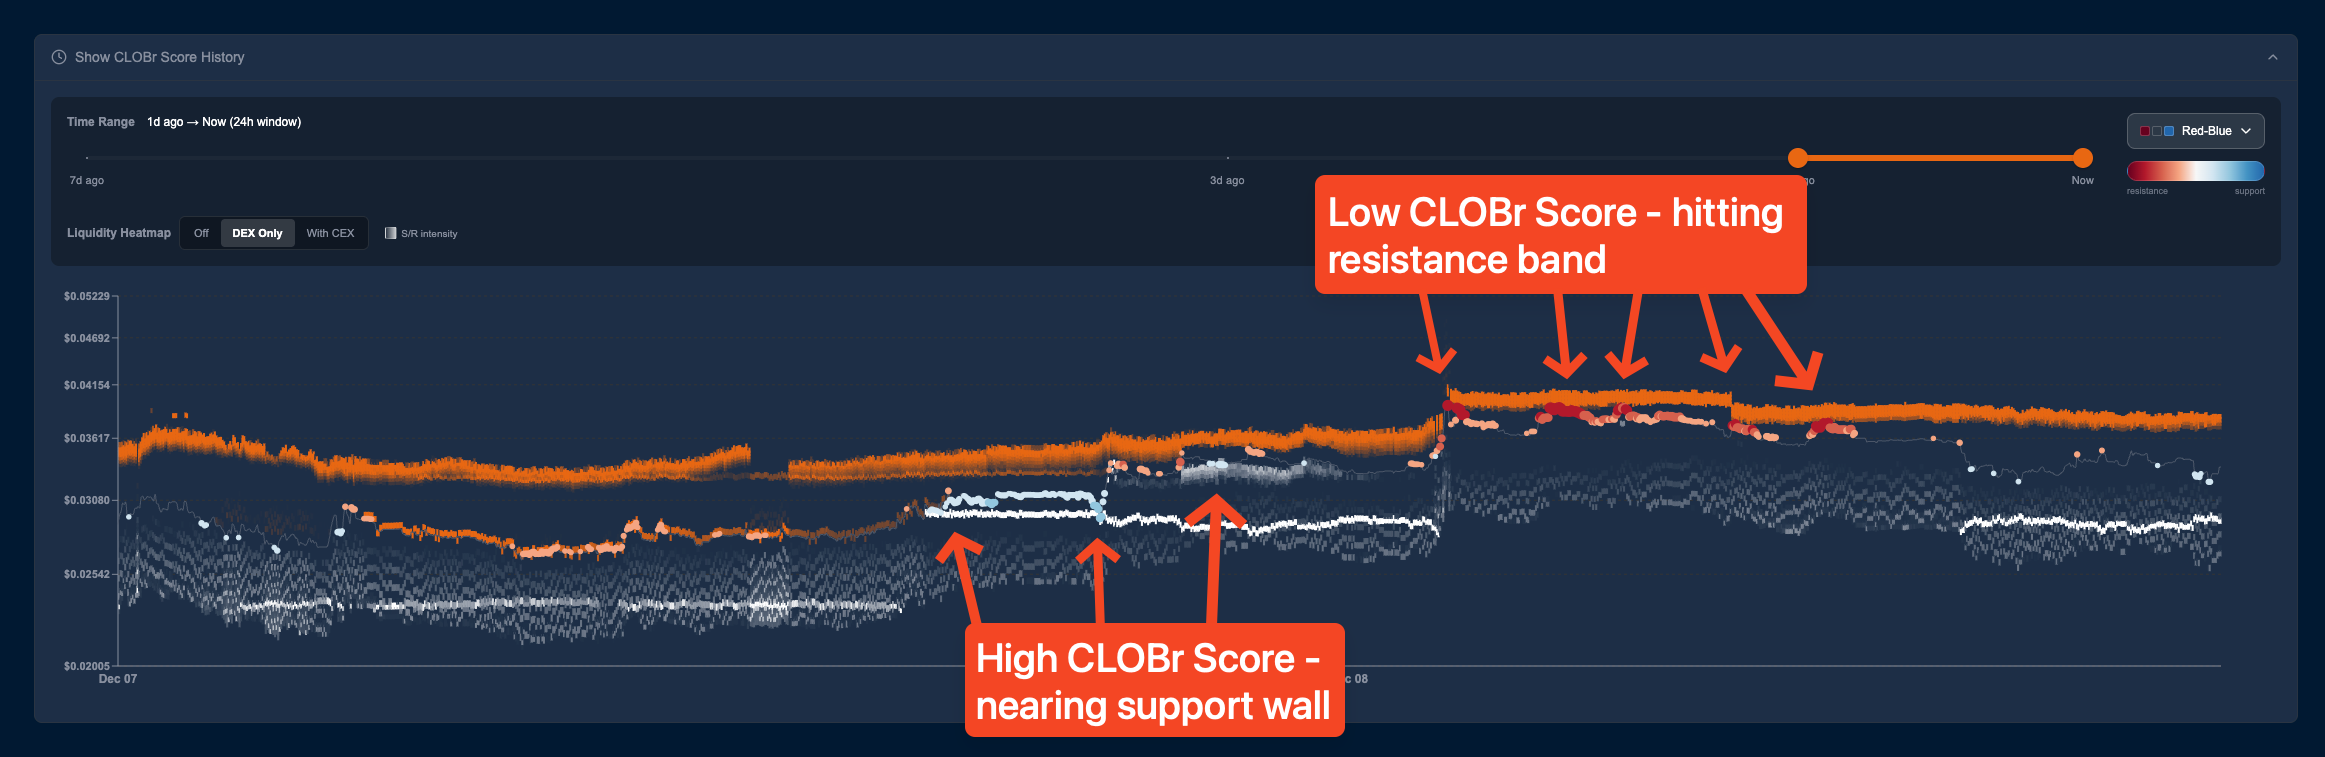
The CLOBr Score is the ratio of support-to-resistance near the current price. The heatmap shows how this played out historically. Support appears as gray-to-white zones (depending on intensity); resistance appears as gray-to-orange.
- White zones: Strong buy-side liquidity (support). Fades to gray as concentration approaches average levels.
- Orange zones: Strong sell-side liquidity (resistance). Also fades to gray near average levels.
- Historical context: Watch how liquidity shifted or held as price moved and traders interacted with these levels.
To view the heatmap, click "Show CLOBr Score History" on any token page, then toggle the "Liquidity Heatmap" option.
Token stats
Each token page shows price, market cap, liquidity, volume, holder count, token age, and audit score.
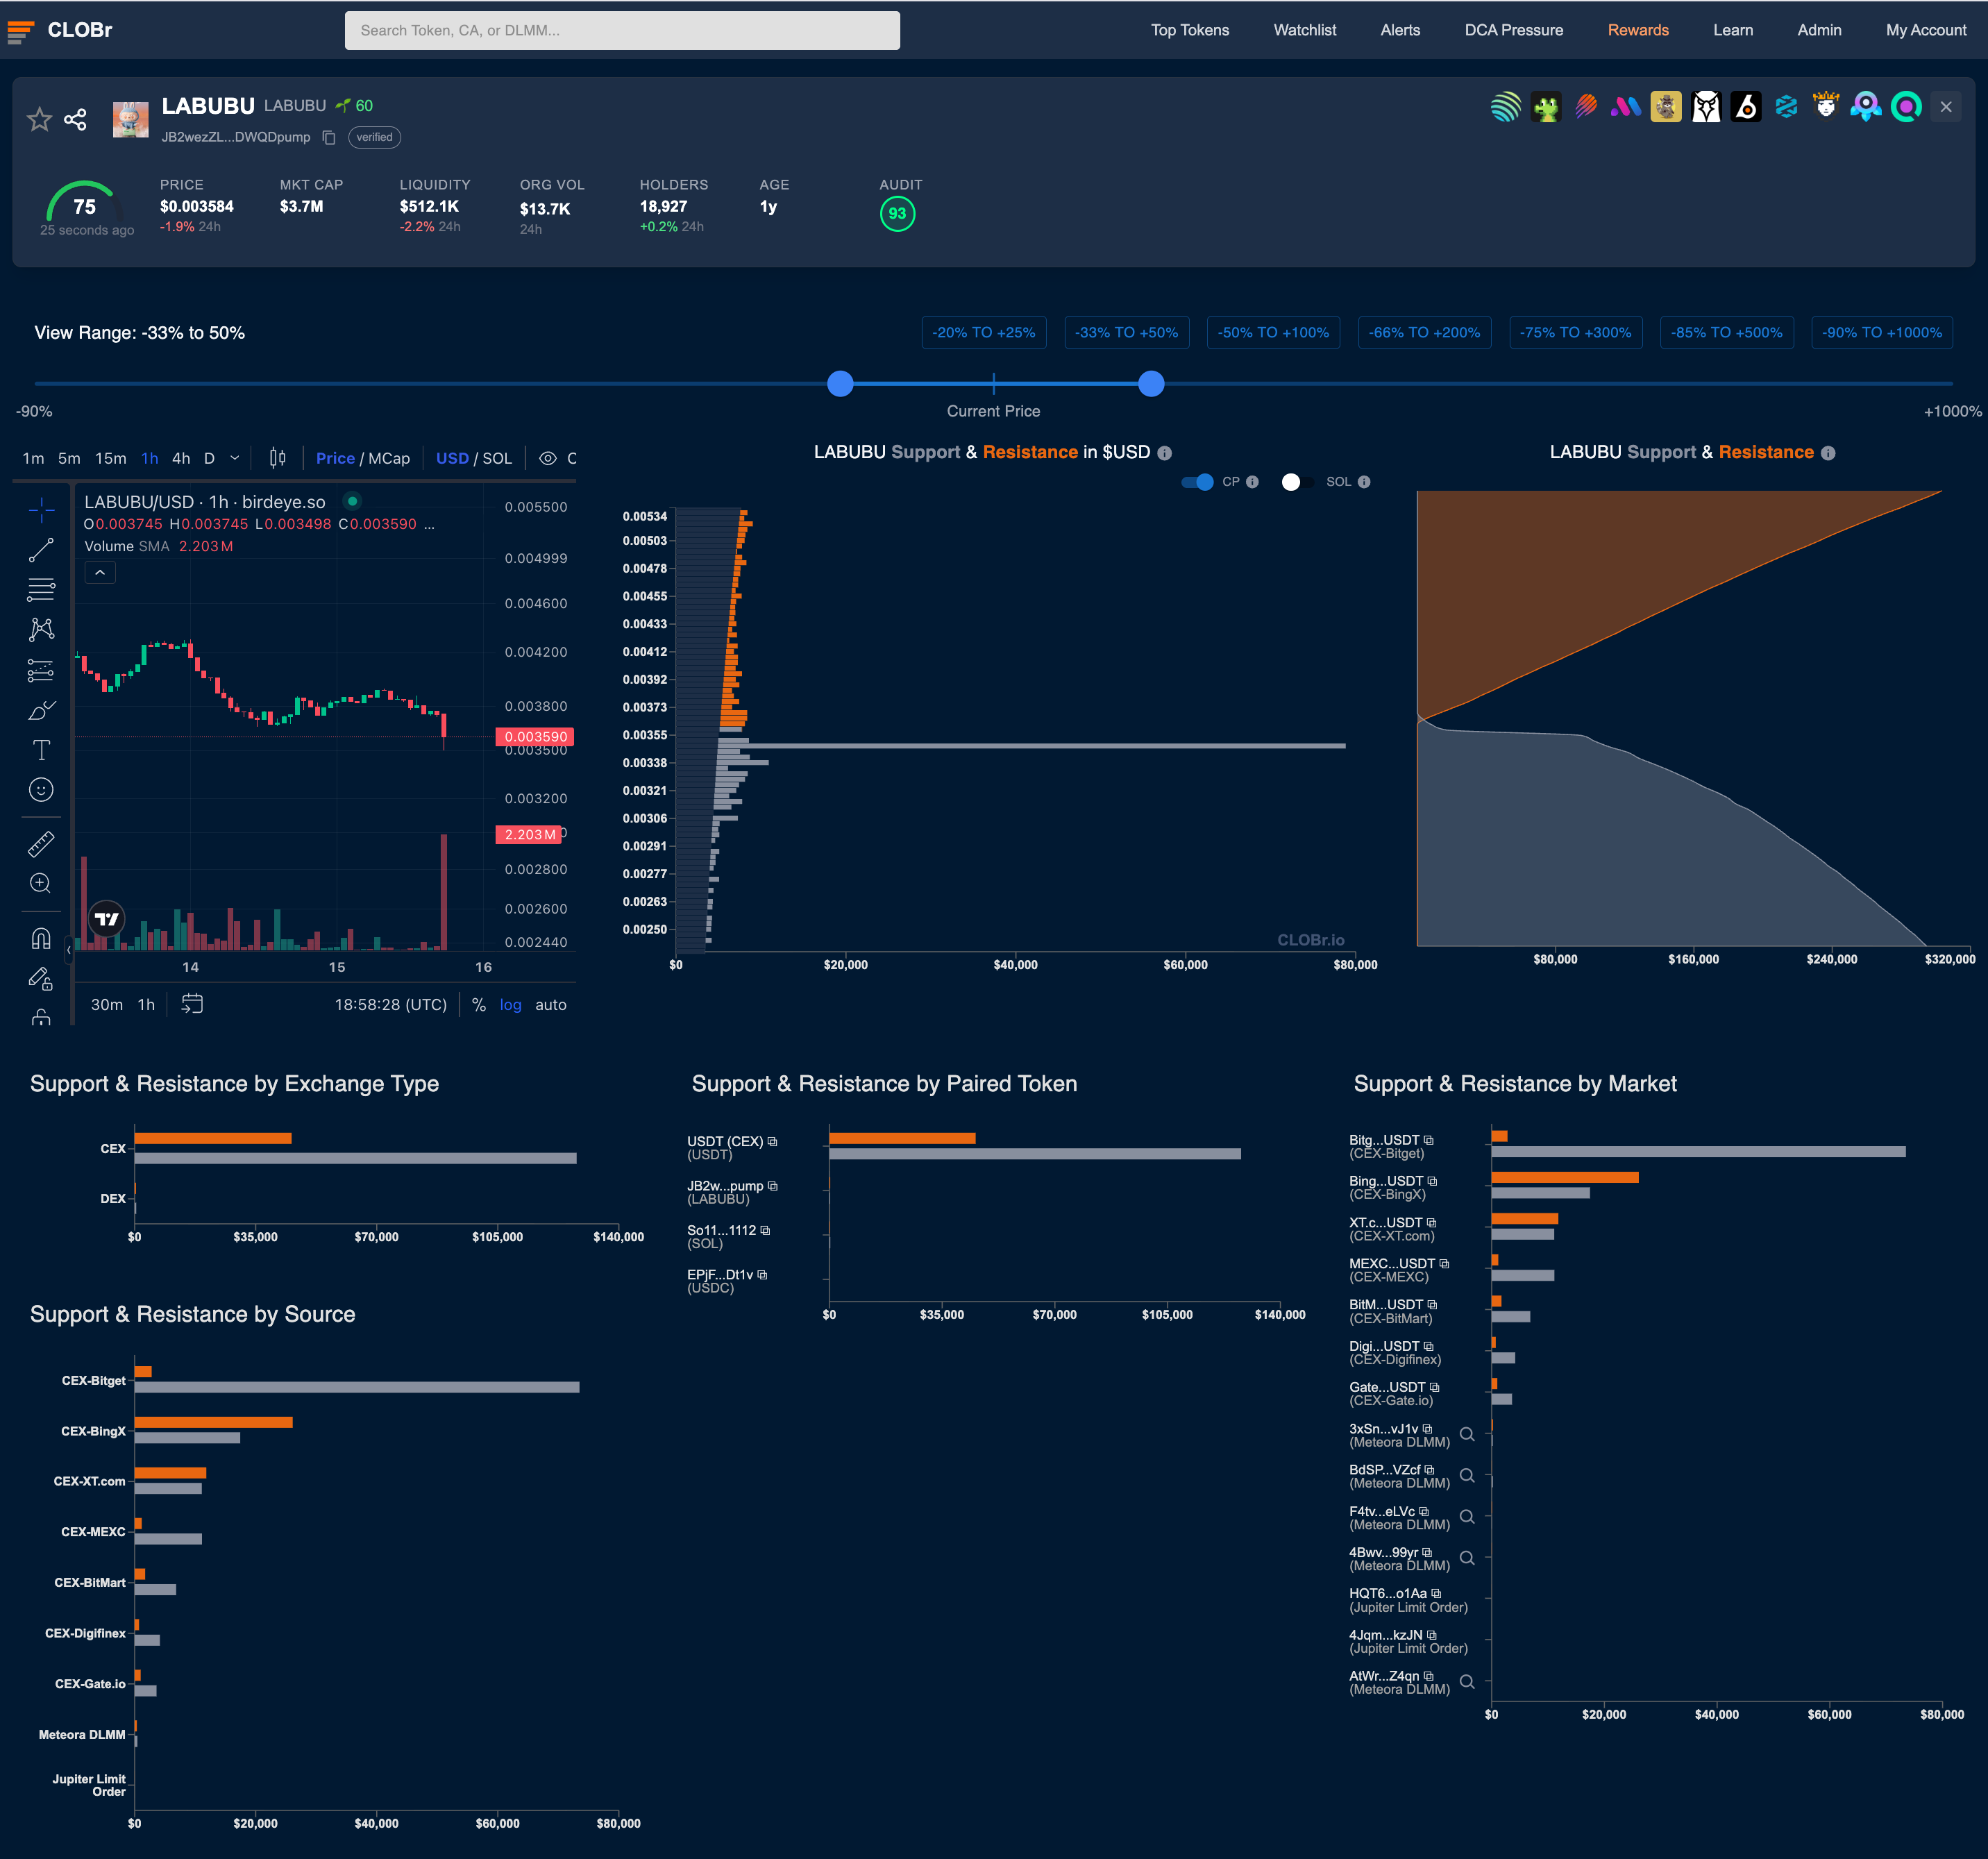
Displayed Information
- Price & Market Cap: Current USD price and fully diluted market cap
- Liquidity: Total across all DEXs and pools
- 24hr Organic Volume: Excludes wash trading and suspicious activity
- Holder Count: Unique wallets holding the token
- Token Age: Time since creation
- Audit Score: 0-100 security rating based on on-chain metrics
- Platform Badges: Which DEXs and protocols support the token
This info is available on the Top Tokens page, Watchlist, and individual token pages.