Swing Trading Meme Tokens
Using liquidity walls to swing trade meme tokens.
The Meme Token Opportunity
Meme tokens have high volatility and concentrated liquidity. CLOBr shows the walls that define their trading ranges.
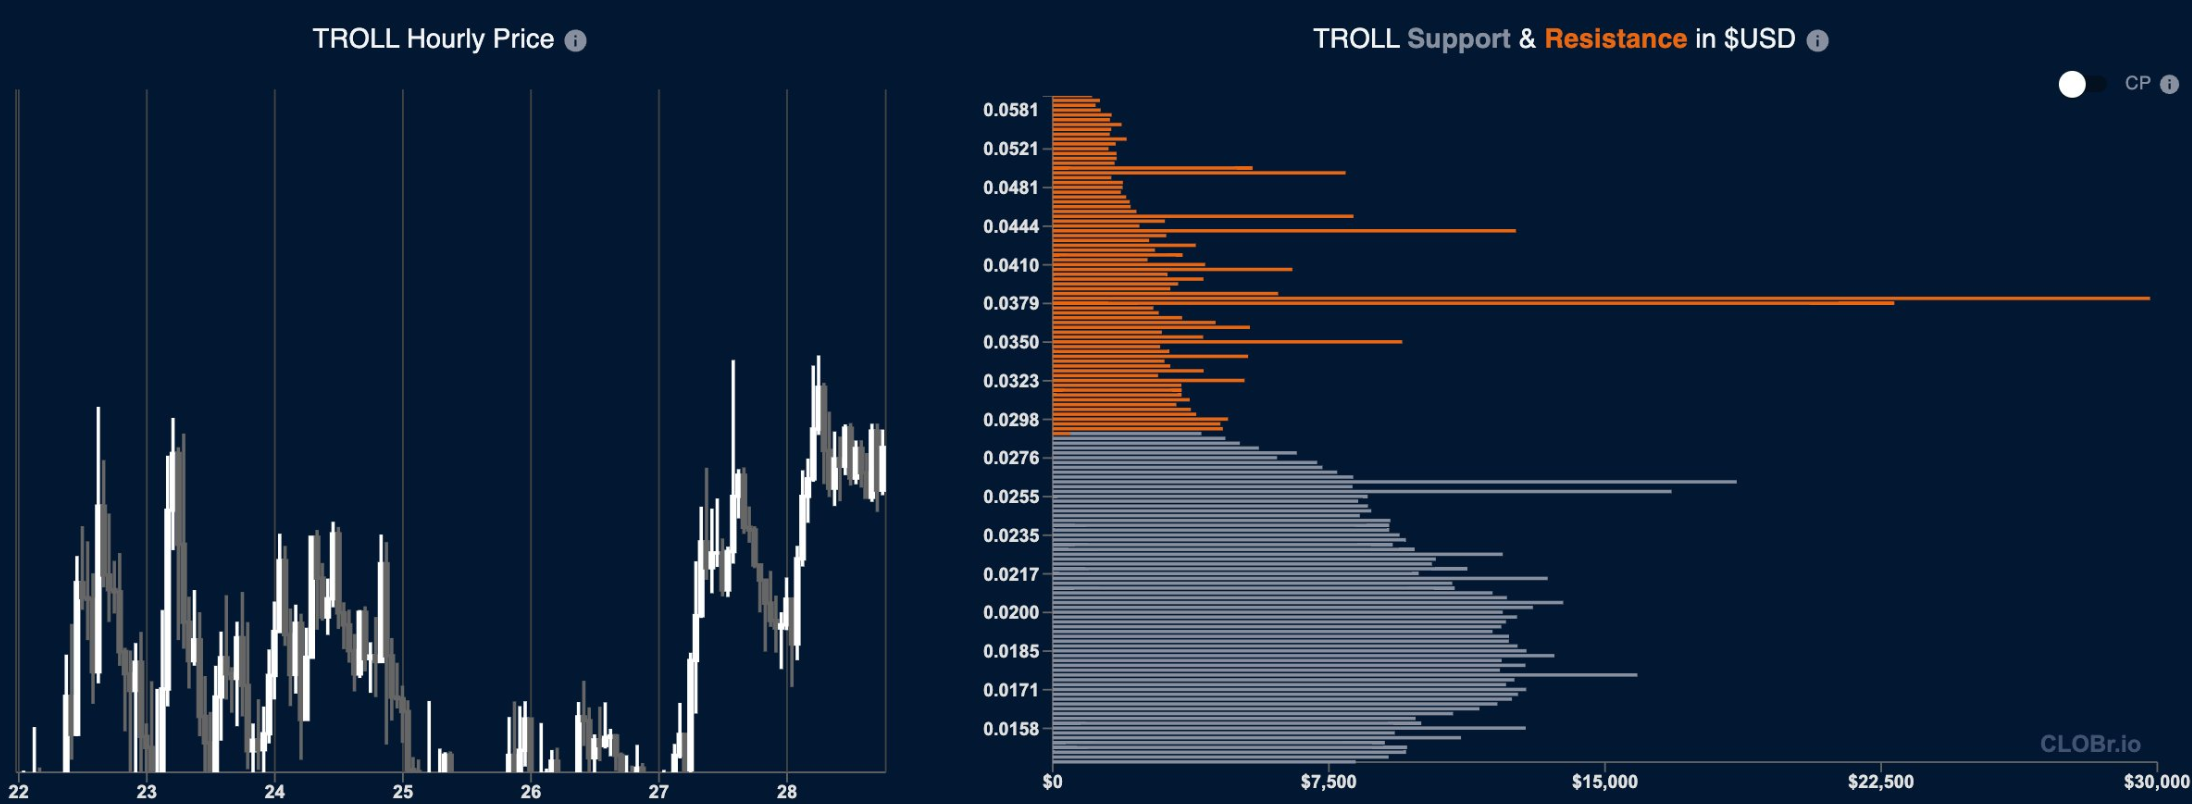
Buy wall below, sell wall above, makes a good range for a swing trade.
How meme token liquidity works
Meme token liquidity looks different from blue chips:
Common Patterns
- Concentrated rather than distributed liquidity
- Significant imbalances between buy and sell sides
- Rapid shifts in liquidity structure
- Price often gravitates between major liquidity zones
- Large walls that form suddenly during hype cycles
vs. major assets
- Greater volatility and liquidity gaps
- Often dominated by a few large liquidity providers
- Stronger impact from social media events
- More pronounced accumulation/distribution patterns
- Faster wall formation and dissolution
The strategy
Find the walls, buy near support, sell near resistance. The liquidity zones define your range.
Step 1: Pick the right tokens
Not every meme token works for this. You need:
- Enough liquidity: At least $250K-$500K total. Below that, you can't get in and out cleanly.
- Clear wall structure: Identifiable walls, not evenly spread liquidity. No walls = no edge.
- Active community: Sustained volume and social media presence.
- Some history: At least a few days of trading data.
- Multiple DEXs: Present on several platforms.
- Do your due diligence: Rugcheck, Bubblemaps, Holderscan -- always check before you trade.
Step 2: Map the liquidity
Open CLOBr and build your picture:
- Find the major walls: Biggest buy and sell walls in your trading range
- Check wall quality: Pair exposure tells you if the wall is solid or flimsy
- Spot the gaps: Thin liquidity between walls = zones where price moves fast
- Look at history: Has price bounced off these levels before?
- Keep watching: Walls form and dissolve. Stay current.
Key Liquidity Scenarios for Meme Tokens
| Scenario | Trading Implication |
|---|---|
| Stacked Buy Walls | Heavy accumulation. Likely to push up. |
| Diminishing Sell Walls | Distribution may be ending. Breakout watch. |
| Wall Imbalance | Price tends to drift toward the thinner side. |
| Large Middle Gap | Price can rip through this zone fast in either direction. |
| New Wall Formation | Someone's positioning. Often precedes a move. |
Step 3: Entries and exits
With the liquidity map in hand, plan your trades:
Entry Points
- Buy at Strong Support: Enter when price approaches major stablecoin-backed buy walls
- Buy on Wall Bounces: Enter after price has tested a wall and shown initial reversal (confirmation candle)
- Buy on Break: After other buyers eat through a major sell wall (high risk, low upside buys), buy the breakout now that you know there's no significant resistance.
- Buy During Wall Formation: When new buy walls suddenly appear, indicating possible accumulation
Exit Points
- Sell Near Resistance: Exit as price approaches major sell walls
- Sell on Diminishing Walls: If support walls start dissolving, consider exiting positions
- Take Partial Profits in Gaps: Scale out of positions near the top of liquidity gap areas
- Sell on Excessive Buildup: When unusually large sell walls form, consider exit (possible distribution), limited upside
Step 4: Risk management
Meme tokens are volatile. Size accordingly and have a plan:
- Position Sizing: Limit exposure to 1-3% of total portfolio per trade
- Stop Placement: Set stops slightly below major buy walls or above major sell walls (for shorts)
- Scaling: Consider scaling in/out rather than entering/exiting all at once
- Profit Taking: Use multiple take-profit levels (e.g., 25% at first target, 50% at second, etc.)
- Time-Based Exits: Have maximum holding periods in case anticipated price shifts don't materialize
Example: Swing trading BONK
Here's how this plays out with BONK:
Scenario Analysis
Initial Liquidity Structure:
- Major buy walls at $0.000020 and $0.000017
- Significant sell walls at $0.000025 and $0.000030
- Wall composition: Buy walls 75% USDC, sell walls mixed exposure
- Notable liquidity gap between $0.000021-$0.000024
Strategy Application:
- Entry: Buy at $0.000021 as price bounces off the $0.000020 support wall
- Stop Loss: Place stop slightly below $0.000017 (the second major buy wall)
- Profit Targets:
- Take 50% profits at $0.000024 (before the first sell wall)
- Take 50% profits at $0.000029 (before the second sell wall)
- Monitoring: Watch for changes in wall size/composition during the trade
Bottom line
- For meme tokens, liquidity structure is often more useful than chart patterns.
- Stablecoin-backed walls are the ones to trust. Check composition.
- Liquidity gaps mean fast moves. Size for them.
- The structure can change fast. If walls shift, your plan should too.
- Volume confirms whether a wall is being respected or eaten through.