Understanding DCA Orders in CLOBr
How DCA orders show up in CLOBr and why they behave differently from traditional liquidity walls.
What are DCA Orders?
DCA orders spread buys or sells over time instead of executing all at once. Traditional liquidity walls (concentrated pools, limit orders) stack capital at specific price levels. DCA orders don't -- they create distributed pressure across a range of prices.
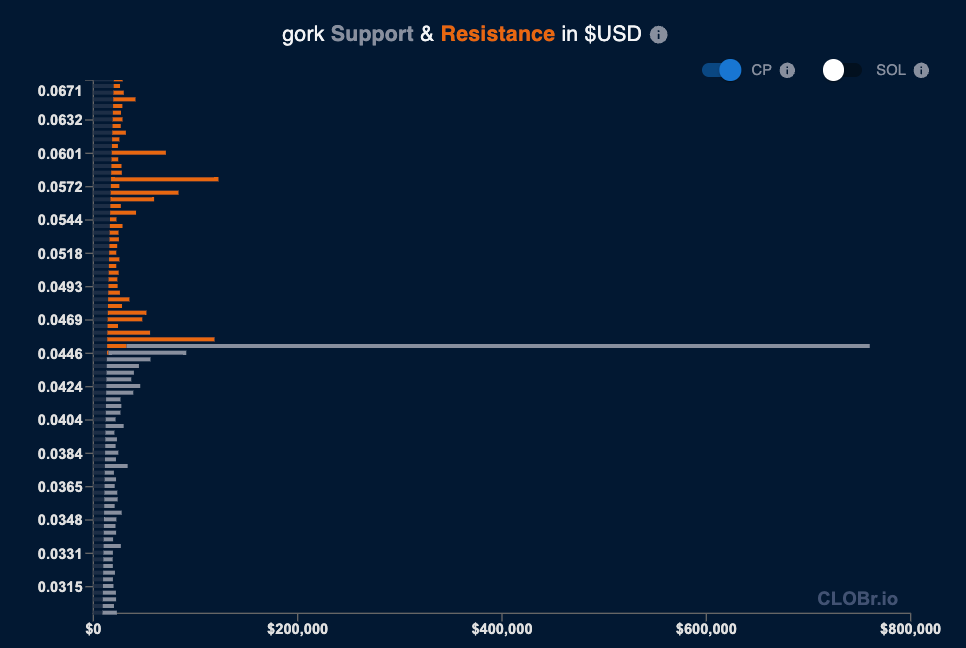
CLOBr visualization of DCA orders - looks like a normal wall
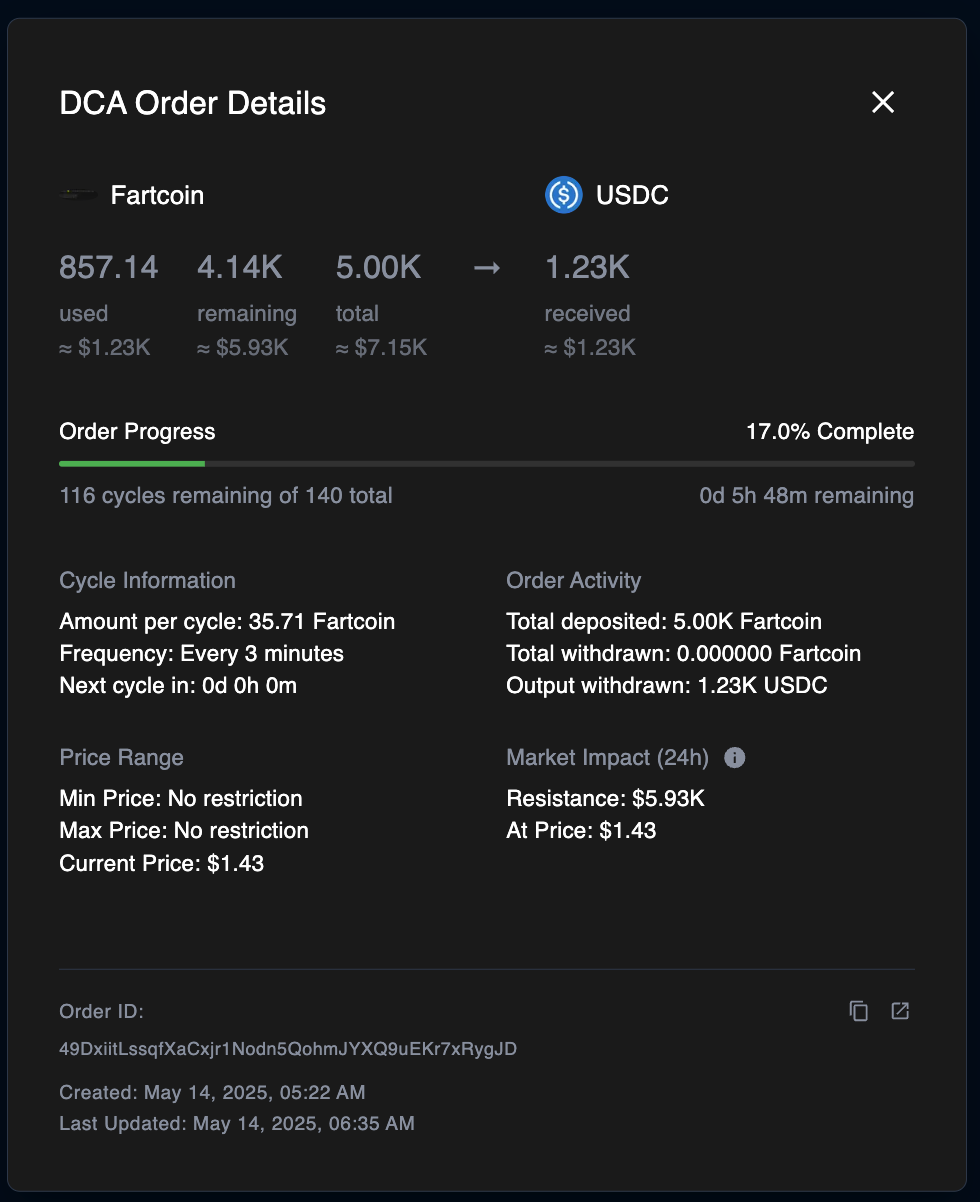
Detailed view of a DCA order showing progress, amounts, and timing
How CLOBr Handles DCA Orders
CLOBr aggregates DCA order impact over the next 24 hours, weighted toward shorter timeframes. This keeps the depth chart useful without cluttering it with far-future orders.
- Multi-timeframe windows: Expected volume across 5min, 30min, 1hr, 6hr, and 24hr so you can gauge both immediate and longer-term impact
- Distributed pressure: Unlike walls that create sharp resistance or support, DCA orders apply gradual or aggressive pressure depending on cycle frequency. They can actually MOVE the price instead of STOPPING price movement.
- Live updates: Orders update continuously as they execute, so remaining impact stays current
- Click for details: Click any DCA order in the chart to see progress, amounts used/remaining, and cycle timing
DCA Orders vs. Traditional Walls
The distinction matters for how you read the chart:
| Characteristic | Traditional Walls | DCA Orders |
|---|---|---|
| Execution | All at once at specific price | Spread over time and price range |
| Price Impact | Sharp resistance/support | Gradual pressure |
| Visualization | Distinct bars at price levels | Aggregated at the bar closest to the current price |
| Market Impact | Price tends to respect levels | Creates buying/selling pressure |
Live DCA Pressure Dashboard
A dedicated page showing all active DCA orders across Solana. Spot which tokens have systematic buy or sell pressure from recurring orders before it shows up in price.
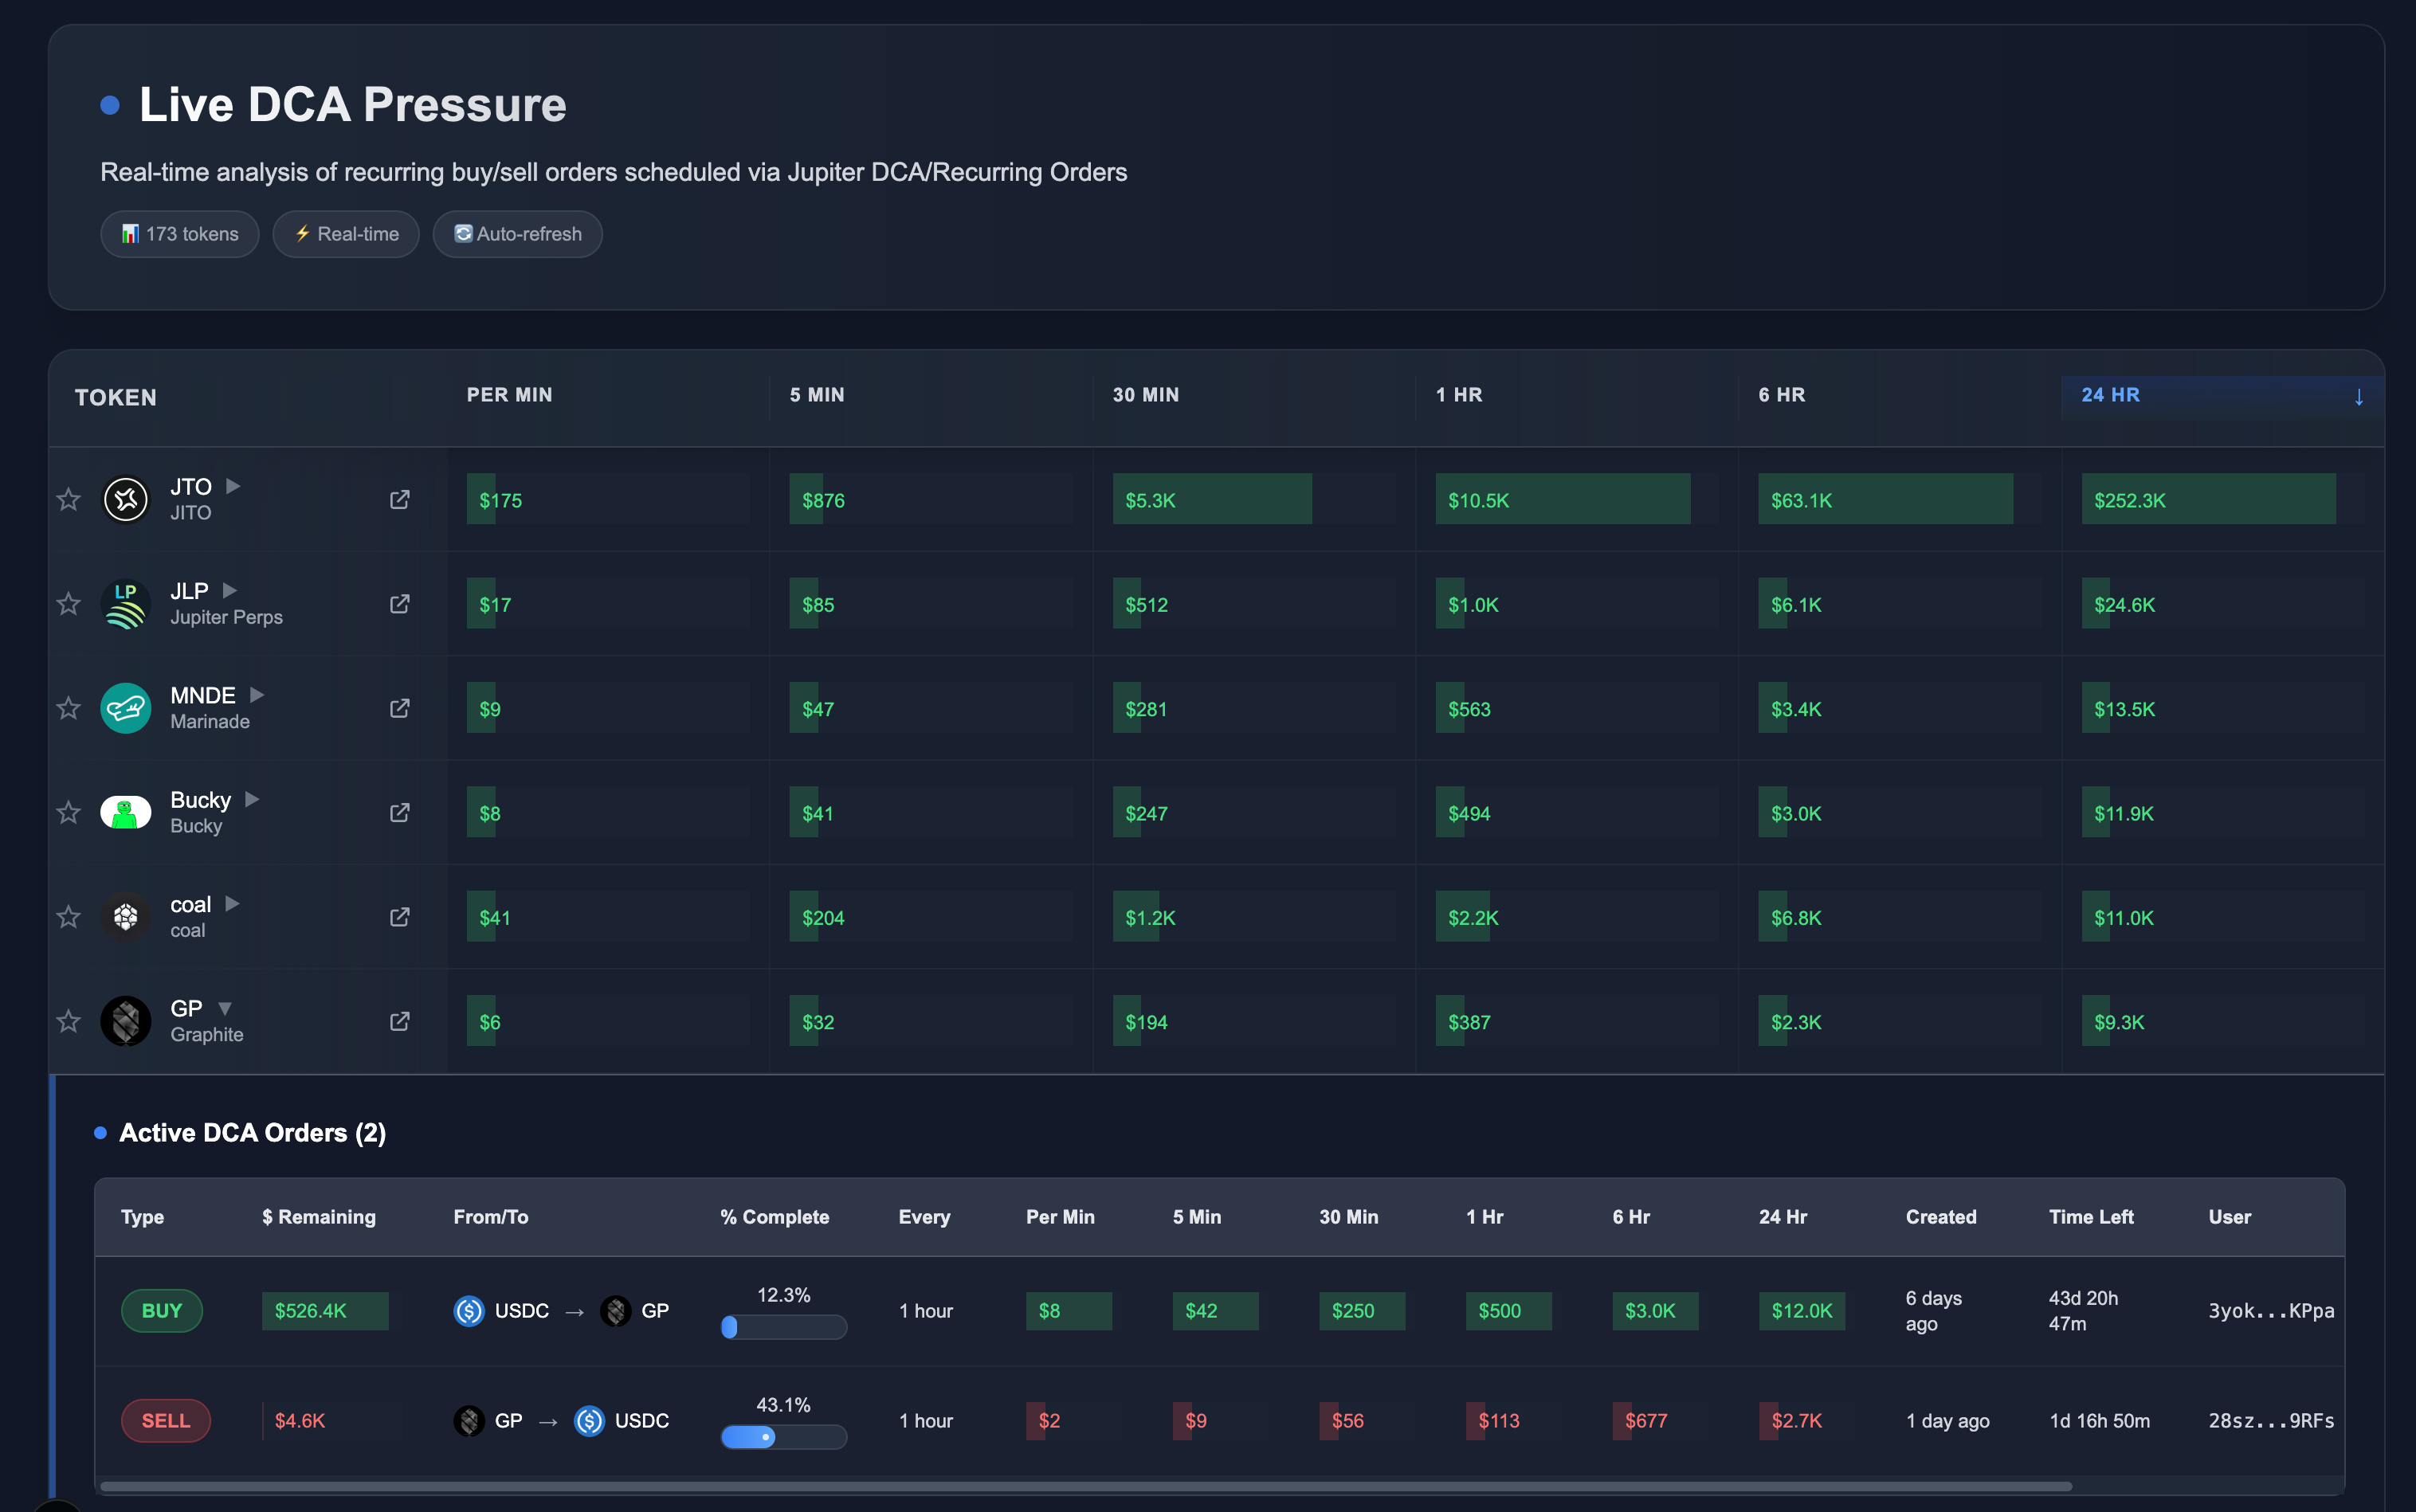
Live DCA Pressure dashboard showing active orders across multiple time windows
- All tokens with active DCA orders in one place, sorted by volume
- Expected order volume across 5min, 30min, 1hr, 6hr, and 24hr windows
- Buy pressure (green) vs. sell pressure (red) at a glance
- Auto-refreshing data
- Click any row to expand and see individual DCA orders for that token
Sustained DCA activity on a token can indicate insider accumulation, smart money positioning, or planned distribution. The pressure page lets you spot these trends before they show up in price action.
Trading Implications
When reading CLOBr, consider both DCA orders and traditional walls:
- Traditional walls give clearer S/R levels. DCA orders create zones of pressure instead.
- DCA orders act as a force pushing price in one direction, not a hard barrier to movement.
- Think in terms of the 24-hour window when sizing up DCA order impact.
- Click any DCA order in the markets chart for details on progress, amounts, and timing. Links to Solscan are included.
- Check the Live DCA Pressure dashboard to spot emerging systematic activity across the ecosystem.
Quick Reference
- CLOBr shows DCA orders as their expected 24hr impact, weighted toward shorter timeframes
- They create distributed pressure, not sharp S/R
- Read both DCA orders and traditional walls together for the full picture
- DCA activity often signals longer-term sentiment and directional intent