Introduction to Trading with CLOBr
Get an overview of how CLOBr enhances trading strategies and complements traditional technical analysis.
CLOBr as a Trading Tool
CLOBr offers traders a unique advantage by providing visibility into market structure that isn't available through traditional price charts alone. While price charts show what has happened, CLOBr reveals the underlying liquidity that influences what will happen next.

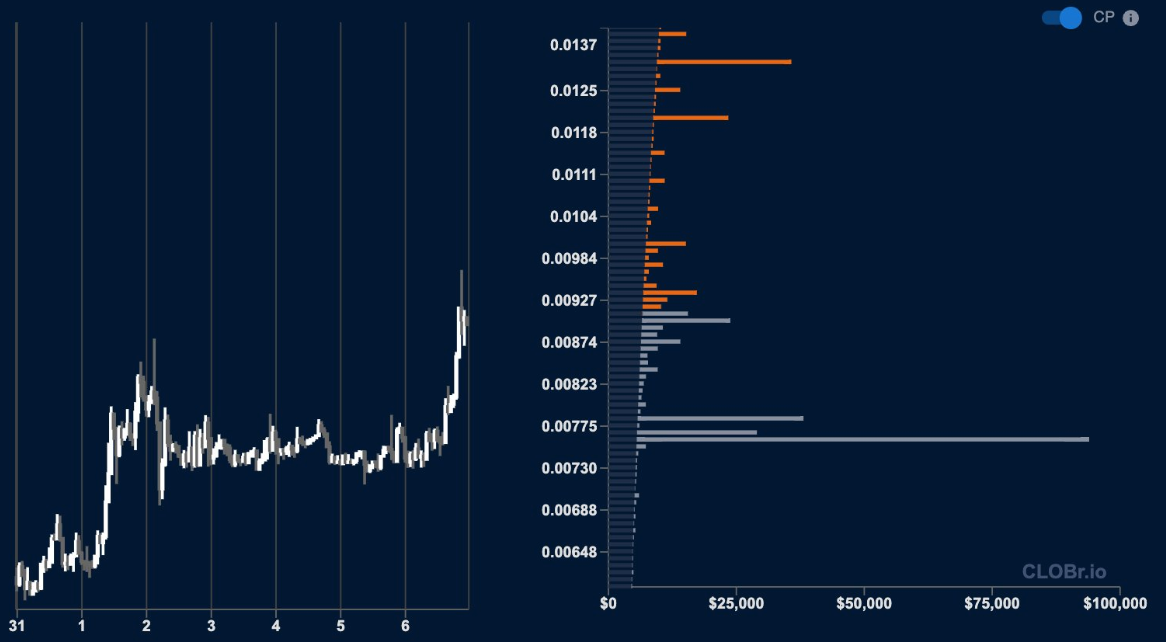
CLOBr depth chart shows a large buy wall, and the price respects the wall as support.
Integrating CLOBr with Traditional Analysis
CLOBr isn't meant to replace your existing trading tools, but rather to complement them. By combining CLOBr's liquidity insights with traditional technical and fundamental analysis, you can develop a more comprehensive trading approach.
Traditional Tools
- Price action and candlestick patterns
- Support and resistance from price history
- Technical indicators (RSI, MACD, etc.)
- Volume analysis
- Trend lines and chart patterns
- Fundamental analysis
CLOBr's Additions
- Real liquidity-based support and resistance
- Token composition of walls (pair exposure)
- Price impact analysis
- Historical liquidity shifts
- Multi-source liquidity aggregation
- Wall quality assessment
Key Trading Principles with CLOBr
When incorporating CLOBr into your trading strategy, keep these core principles in mind:
1. Respect Liquidity Walls
Large liquidity concentrations often act as strong support and resistance levels. Price tends to react to these levels even if they don't align with traditional technical levels.
- Consider taking profits before large sell walls
- Look for buying opportunities near strong buy walls
- Use walls to set stop loss and take profit levels
2. Consider Wall Quality, Not Just Size
The composition of a wall matters as much as its size. Stablecoin-backed walls tend to be more reliable than walls composed of volatile tokens.
- Check pair exposure before making trading decisions
- Trust stablecoin-dominated walls more than others
- Be cautious with walls that are primarily volatile tokens
3. Watch for Liquidity Shifts
Major changes in liquidity structure often precede price movements. The sudden appearance or disappearance of walls can signal impending market moves.
- Monitor for large new walls forming (potential accumulation/distribution)
- Be alert when established walls start to diminish
- Consider historical patterns in wall formation and dissolution
4. Look for Liquidity Gaps
Areas with little liquidity (gaps between walls) represent zones where price can move quickly with minimal resistance. These areas can present both opportunities and risks.
- Expect faster price movement through thin liquidity zones
- Consider scaling into or out of positions in gap areas
- Be prepared for increased volatility in liquidity gaps
5. Combine Timeframes
Just as with price charts, looking at liquidity across different timeframes provides a more complete picture of market structure.
- Check historical liquidity patterns for context
- Look for persistent walls that appear across multiple days
- Compare current liquidity to past market turning points
6. Assess CEX vs DEX Liquidity
CEX order books are almost always concentrated within a few percent of the market price, but the book is constantly changing a market makers automatically re-position themselves.
- Walls from CEXs tend to disappear without being filled during price shifts, while DEX liquidity is more persistent
- Even on reputable CEXs, liquidity is usually real for a single trade on that platform but the book is constantly changing and market makers re-position themselves.
Types of Strategies Using CLOBr
CLOBr can be applied to various trading approaches across different market conditions. In the following sections, we'll explore specific strategies in detail, including:
Strategy Type | Market Condition | Primary CLOBr Feature |
---|---|---|
Swing Trading Meme Tokens | Volatile, trending markets | Liquidity walls as entry/exit points |
Reducing Risk Ahead of Sell Walls | Uptrending, approaching resistance | Sell wall identification |
Shorting on Perps Below Sell Walls | Topping patterns, major resistance | Sell wall quality analysis |
DLMM Positioning Between Walls | Range-bound markets | Multi-level liquidity analysis |
Buying on Top of Buy Walls | Pullbacks in uptrends | Buy wall identification |
Getting Started with CLOBr-Enhanced Trading
As you begin incorporating CLOBr into your trading process, consider this approach:
- Start by observing without trading—watch how price interacts with liquidity walls
- Begin with smaller position sizes until you've verified the reliability of your CLOBr insights
- Keep a trading journal that specifically notes liquidity conditions alongside traditional factors
- Develop your own scoring system for wall quality based on your observations
- Gradually incorporate more advanced CLOBr features as you become comfortable with the basics
Remember that while CLOBr provides valuable insights, no single tool can guarantee trading success. Always consider risk management principles and use CLOBr as part of a comprehensive trading approach.