Token Page Tabs
Eight tabs under the depth chart, each answering one question about who is positioned where. This page walks all of them, novice to expert.
Table of Contents
The tab strip at a glance
Under the depth chart on every token page sits a strip of eight tabs. The chart shows you where the walls are; the tabs show you who built them and how they behave. Each tab answers one question:
| Tab | The question it answers |
|---|---|
| Markets | Where does this token actually trade, and with how much depth at each venue? |
| DCA Orders | Is someone buying or selling on a schedule, and how much is left to execute? |
| Limit Orders | Where are resting bids and asks parked, including the ones that hide their price? |
| DLMM Pools | How is concentrated liquidity shaped around price, pool by pool? |
| Pools | Which pools does this token trade in on Robinhood Chain, and how deep, hooked, and concentrated is each one? |
| Whale Activity | Are the biggest holders adding, exiting, or rotating? |
| Liquidity Ratios | How hard is each pooled dollar working, and is the float where you think it is? |
| LP Simulator | If I LP this token, what would my range earn? |
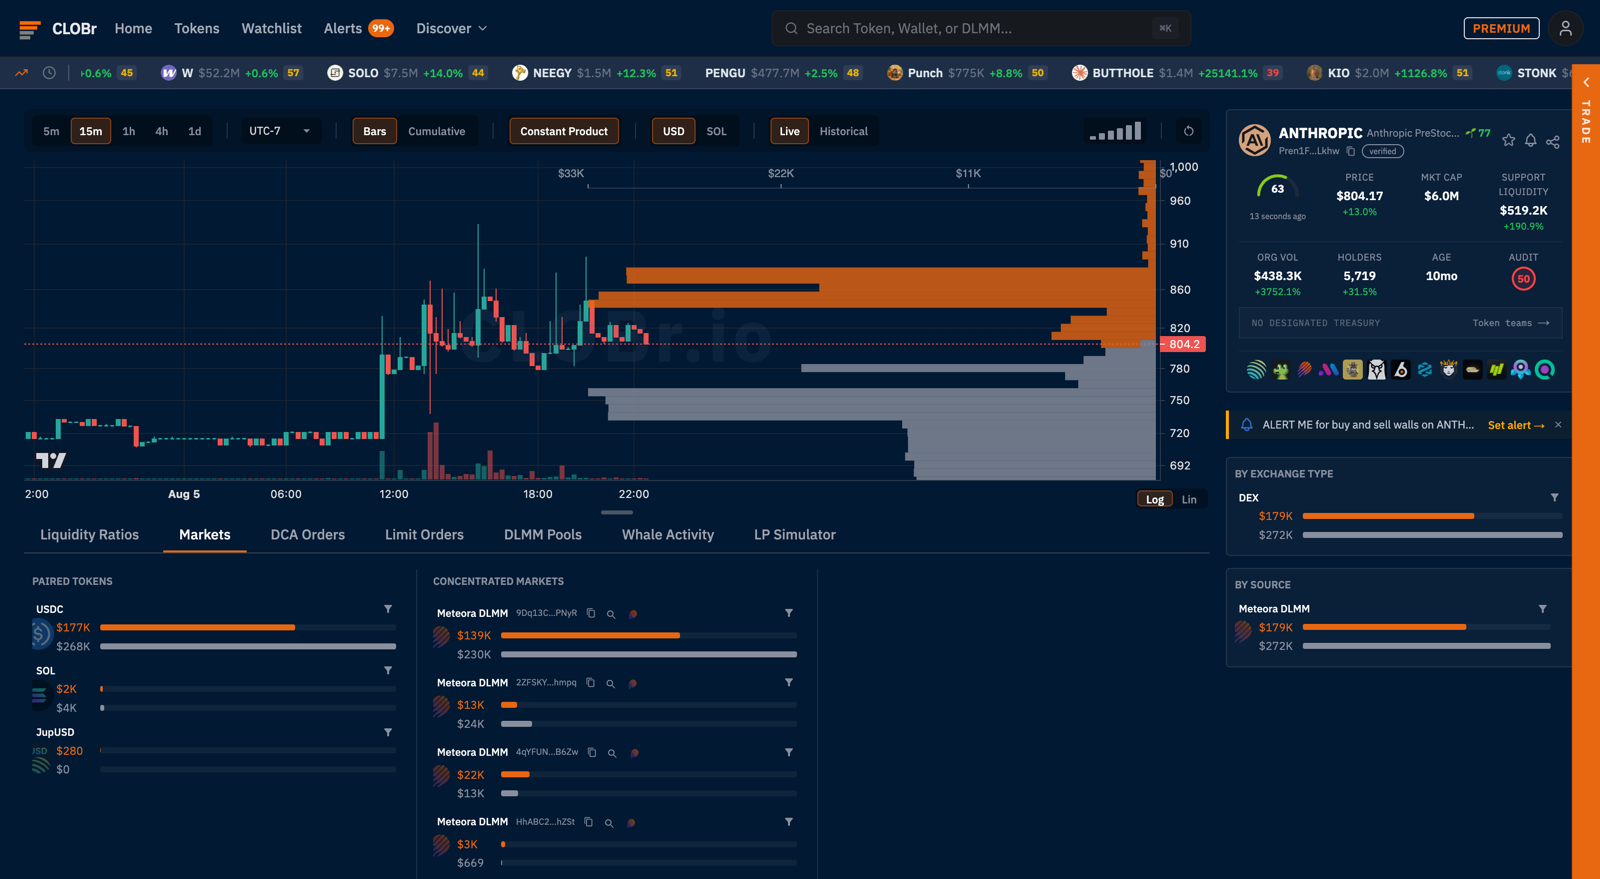
Markets
Every venue holding this token across DEXs and CEXs, split three ways: Paired Tokens (how liquidity divides across USDC, SOL, and other pairs), Concentrated Markets (each DLMM and CLMM pool with its live bid/ask liquidity), and constant-product pools. Each pool row shows liquidity on both sides of price, so you can see which single pool actually carries the token and which are dust.
Use it to answer the exit question before you enter: if the top pool holds 80% of the depth and its bid side is thin, the aggregate numbers flatter the token.
DCA Orders
Live Jupiter recurring orders targeting this token. The summary row totals scheduled buy and sell pressure over 5min to 24hr windows; the Timeline projects the next 24 hours of scheduled executions, so you can see programmatic flow before it hits. The table below lists each active order: remaining size, from/to tokens, completion percentage, and execution cadence.
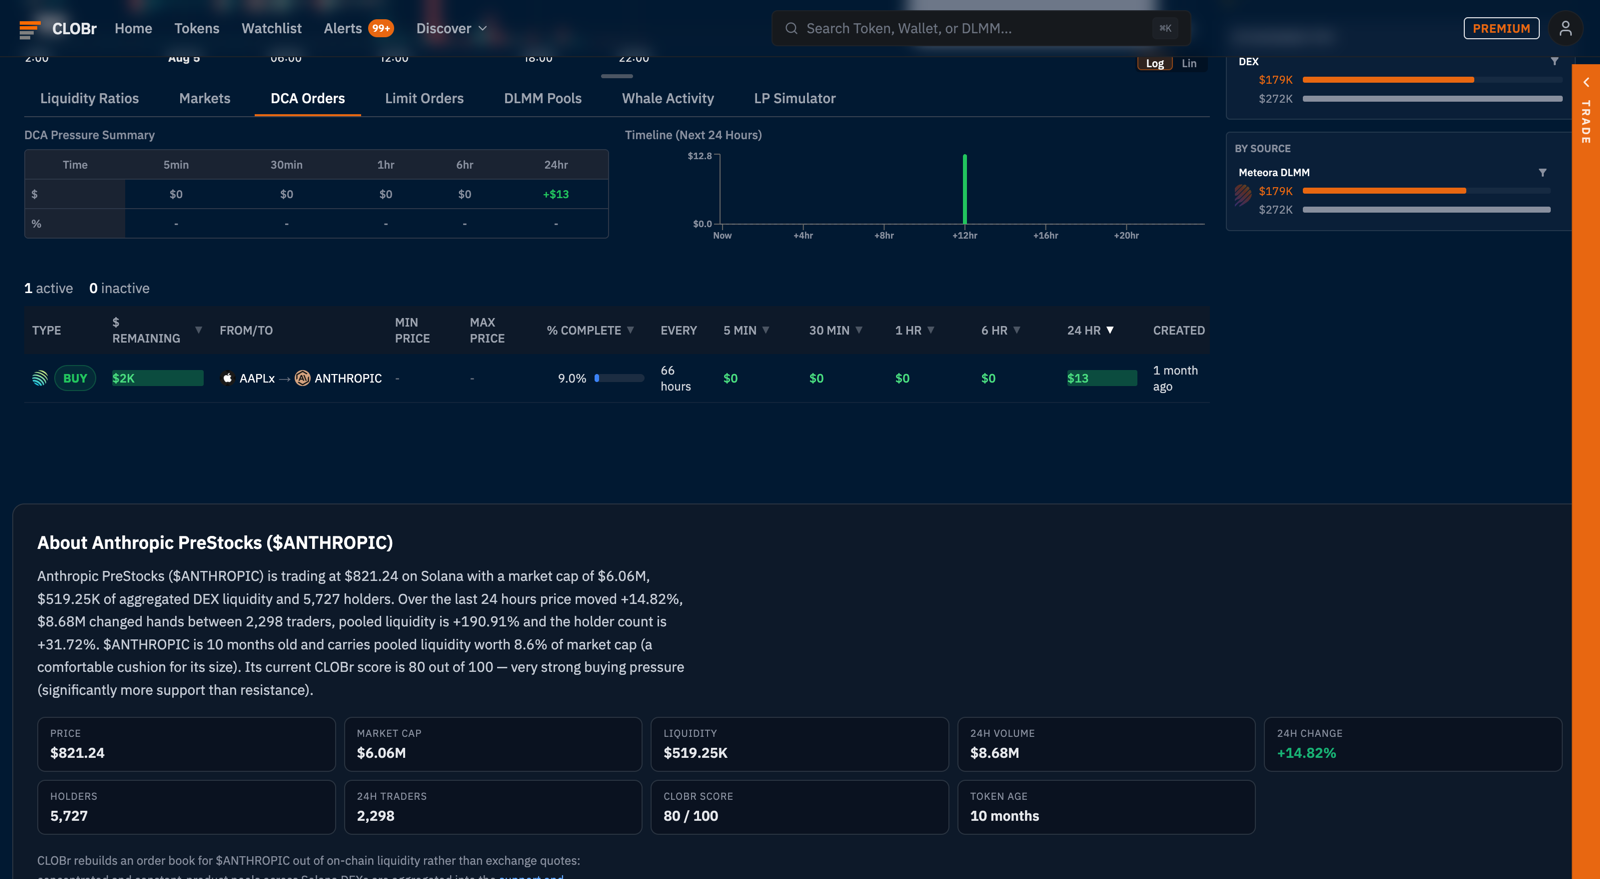
Size matters only relative to liquidity: $29K of scheduled buys into a $160K-liquidity book moves price; $762K into a $3.9M book is noise. Cross-check remaining DCA size against Support Liquidity on the stats panel. Background on the mechanics: Understanding DCA Orders; ecosystem-wide ranking: Live DCA Pressure.
Limit Orders
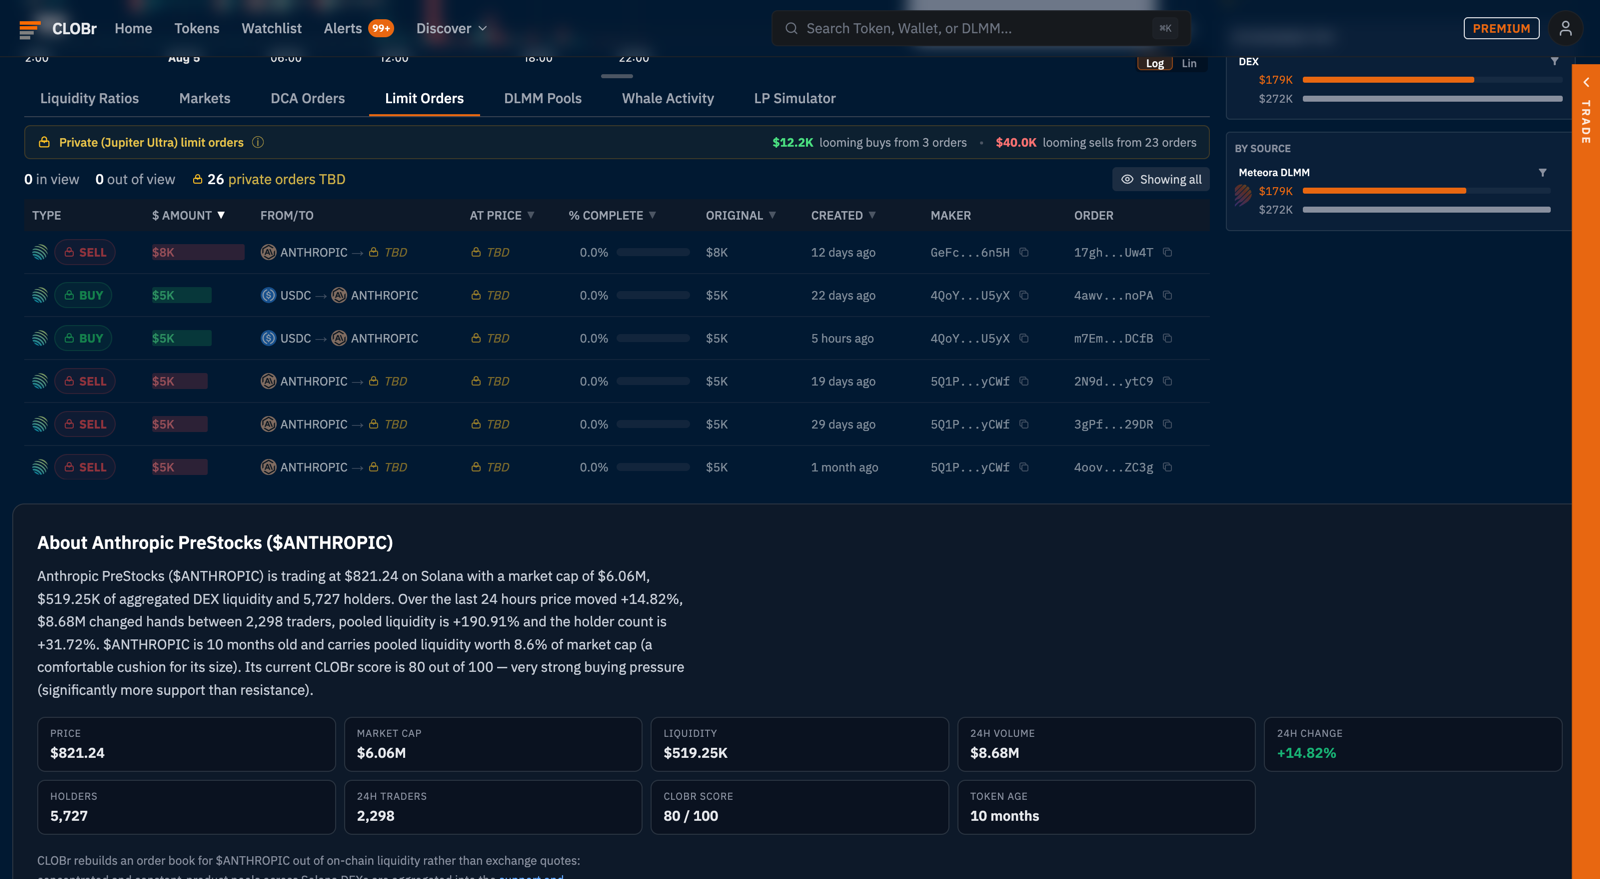
Resting Jupiter limit orders on both sides of price: size, limit price, and distance from market. Clusters of bids form real support; a stack of asks at a round number is a wall someone must eat before price passes. CLOBr also surfaces Jupiter Ultra private limit orders, which hide their trigger price on-chain; CLOBr detects and prices them anyway. These orders also render directly on the depth chart at their price level.
DLMM Pools
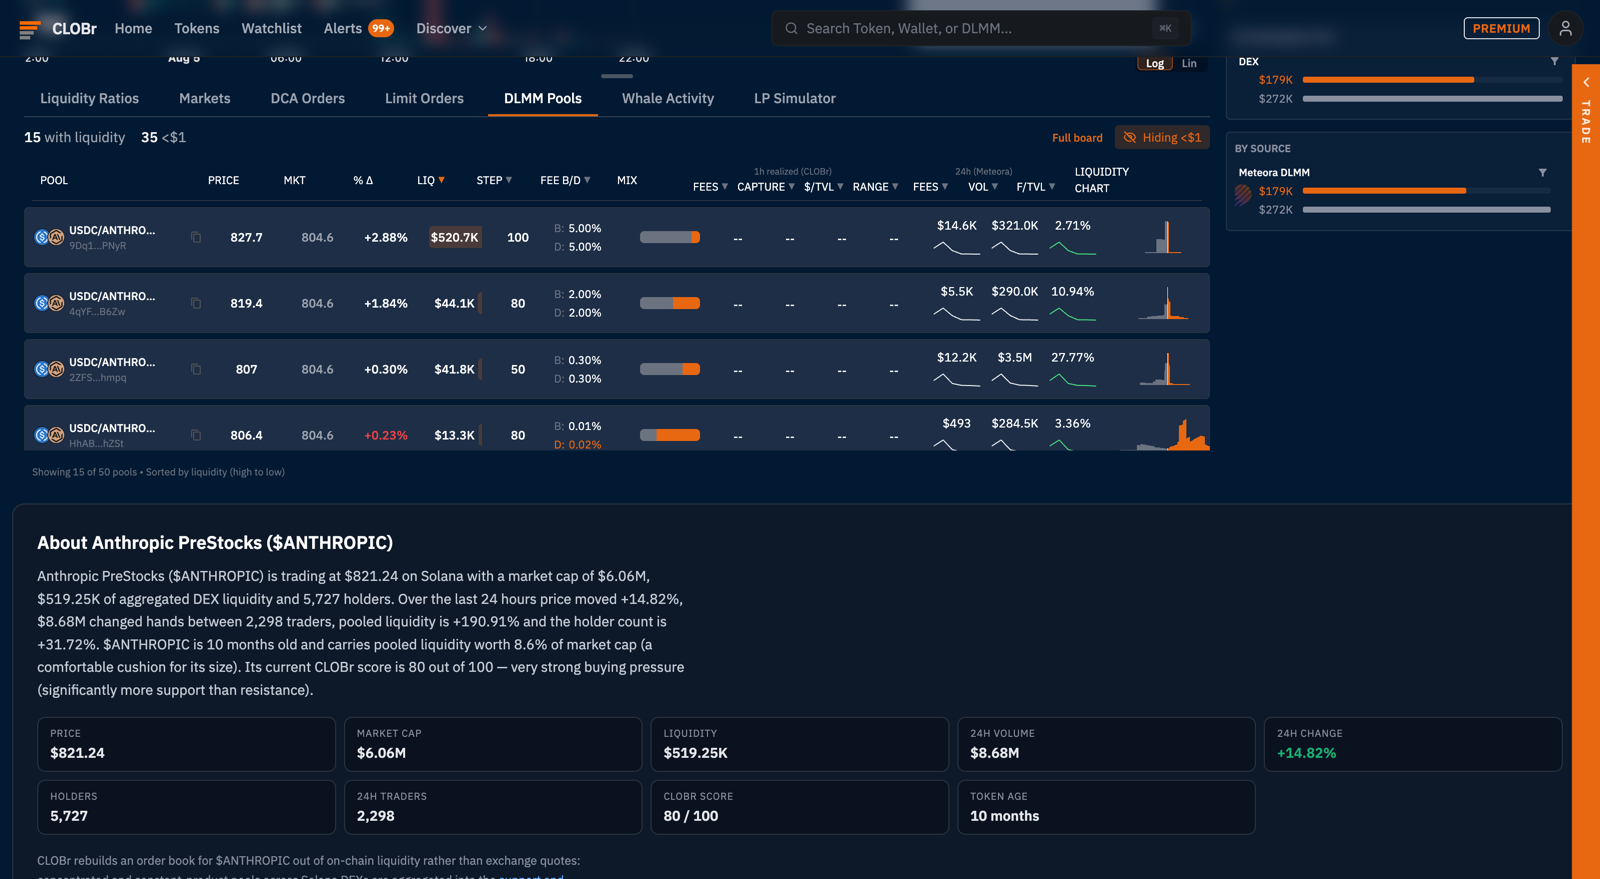
Every Meteora DLMM pool for the token: bin step, base fee, TVL, and how liquidity is distributed across bins around the active price. Traders read it for where concentrated liquidity thins out (price moves fast through empty bins). LPs read it to see where other LPs are ranged before choosing their own. For the full pool-level analysis surface, see DLMM Pool Analysis; to find pools worth this attention in the first place, start at Hot DLMM Pools.
Pools (Robinhood Chain)
Every pool a token trades in on Robinhood Chain, one row per pool. This tab appears for tokens native to Robinhood Chain, and also for Solana tokens whose asset has a Robinhood Chain leg, so you get the same pool-by-pool detail even when you opened the page from the Solana side.
Each row shows the pool's protocol (V2, V3, V4, CL, or LB), the trading pair, the fee, the tick spacing, support and resistance within 25% of price, TVL, LP positions and owners, and a mini liquidity chart. For a pool with a dynamic fee, the fee shown is the live rate its hook is charging right now, not a fixed number. TVL is exact for constant-product pools; for concentrated pools it is a lower bound, shown with a ≥, because some liquidity can sit outside the range CLOBr can measure.
Two flags call out pools that need a second look. HOOK means custom code runs on the pool and takes its own fee after the swap. CURVE HOOK goes further: the hook can settle part of a swap itself, so CLOBr leaves that pool out of depth and scoring rather than count liquidity it cannot verify.
- The filter icon on a row limits the main chart to that one pool, so you can see its liquidity on its own.
- PRICE marks the pool CLOBr is pricing the token from right now.
Whale Activity
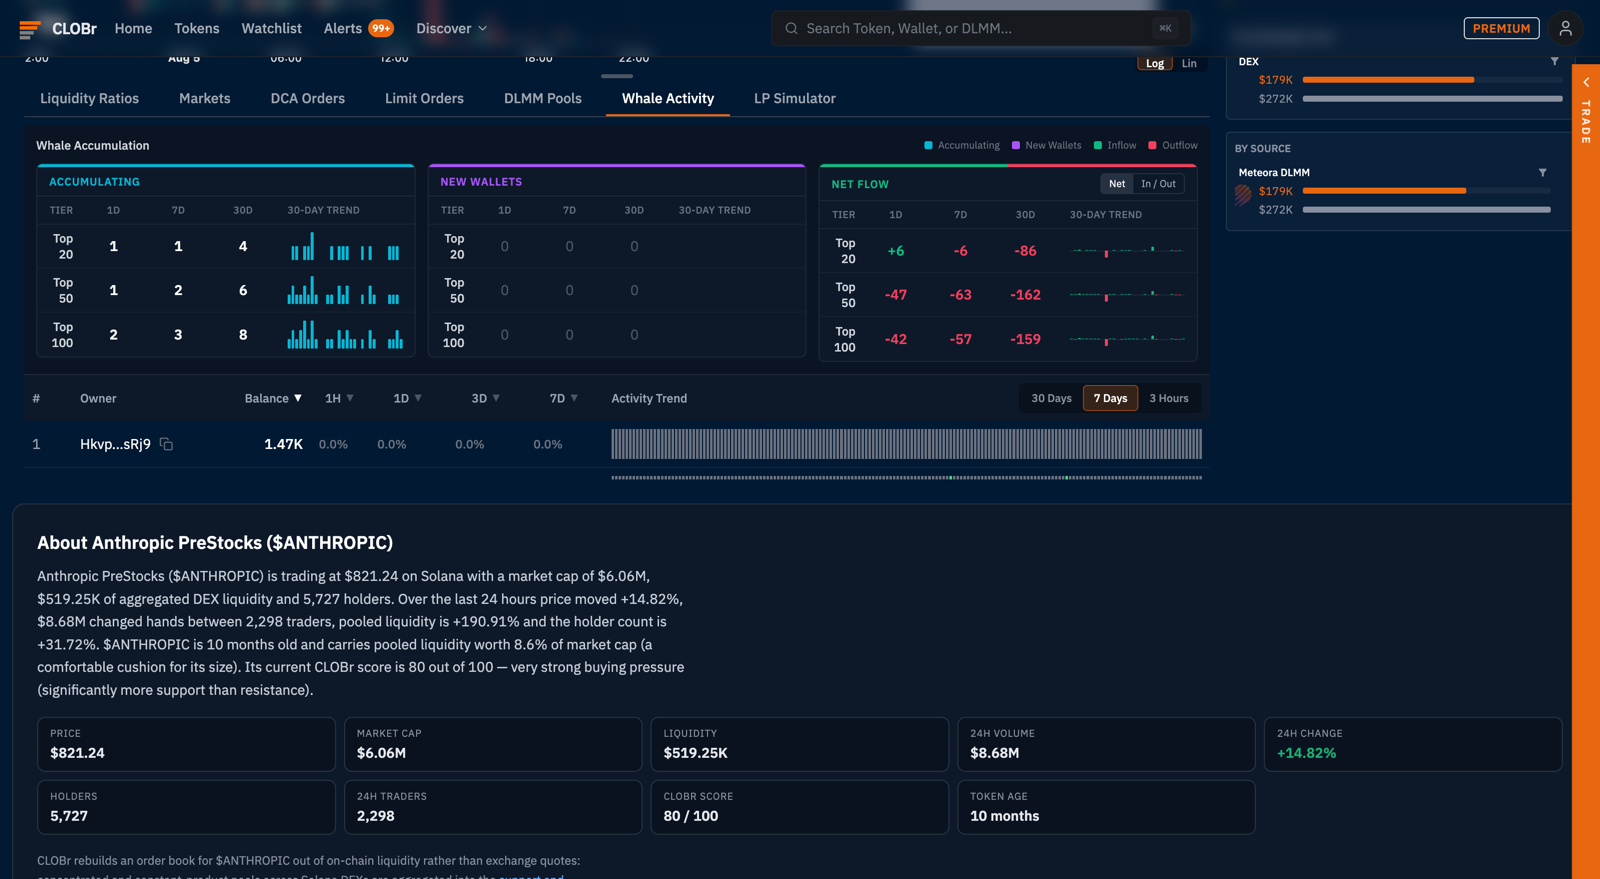
Top-holder behavior in three panels, each across top 20 / top 50 / top 100 tiers and 1D / 7D / 30D windows:
- Accumulating: how many existing top holders added to their position, with a 30-day trend sparkline.
- New Wallets: brand-new wallets entering the top-holder set. A spike here during a pump is distribution finding exit liquidity; a steady trickle while price is flat is fresh conviction.
- Net Flow: net tokens in or out of each tier, toggleable between net and inflow/outflow views.
Below the panels, each tracked wallet gets a row with balance, period-by-period changes, and an activity trend. The same signals are filterable across all tokens on the screener's whale columns.
Liquidity Ratios
The fee-density matrix: rows are organic volume windows (1H "right now", 6H "sustained", 24H "steady state"), columns are three liquidity denominators (the traveled price range, the ±10% band, the ±25% band). Each cell divides volume by that liquidity and shows the token's percentile rank. 1.45x over 24H in the traveled range means each pooled dollar where price actually went turned over 1.45 times that day.
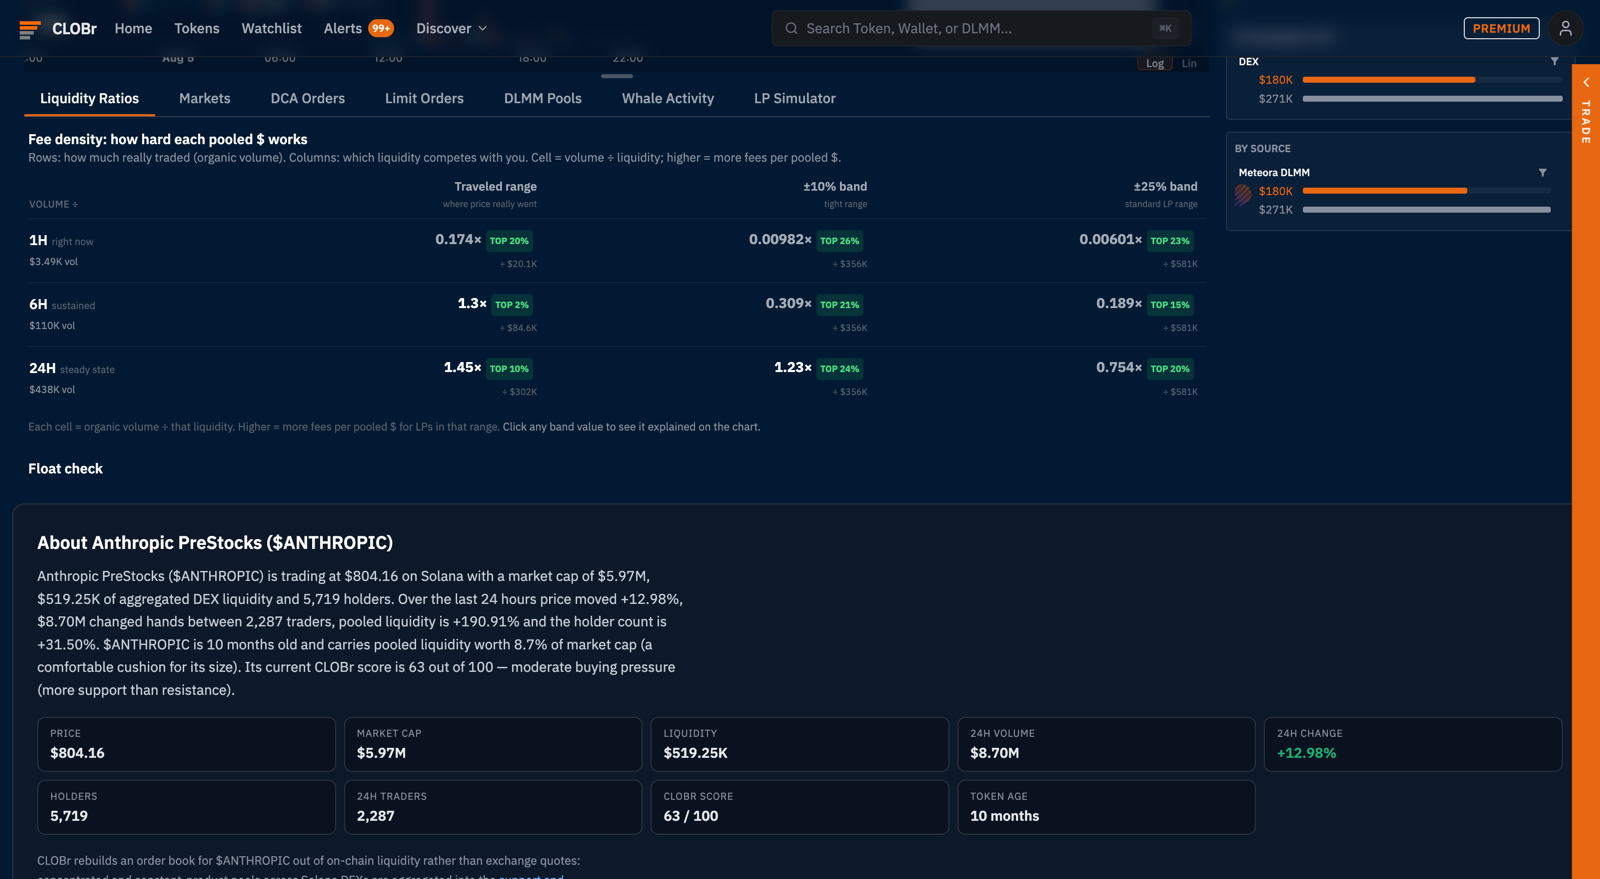
Read rows top to bottom to see whether activity is accelerating (1H above 24H) or cooling. Read columns left to right to see how tightly the action hugs price. The Float check below the matrix sanity-checks where the tradable supply actually sits. The same math ranks all tokens on the LP Fee Cheat Sheet.
LP Simulator
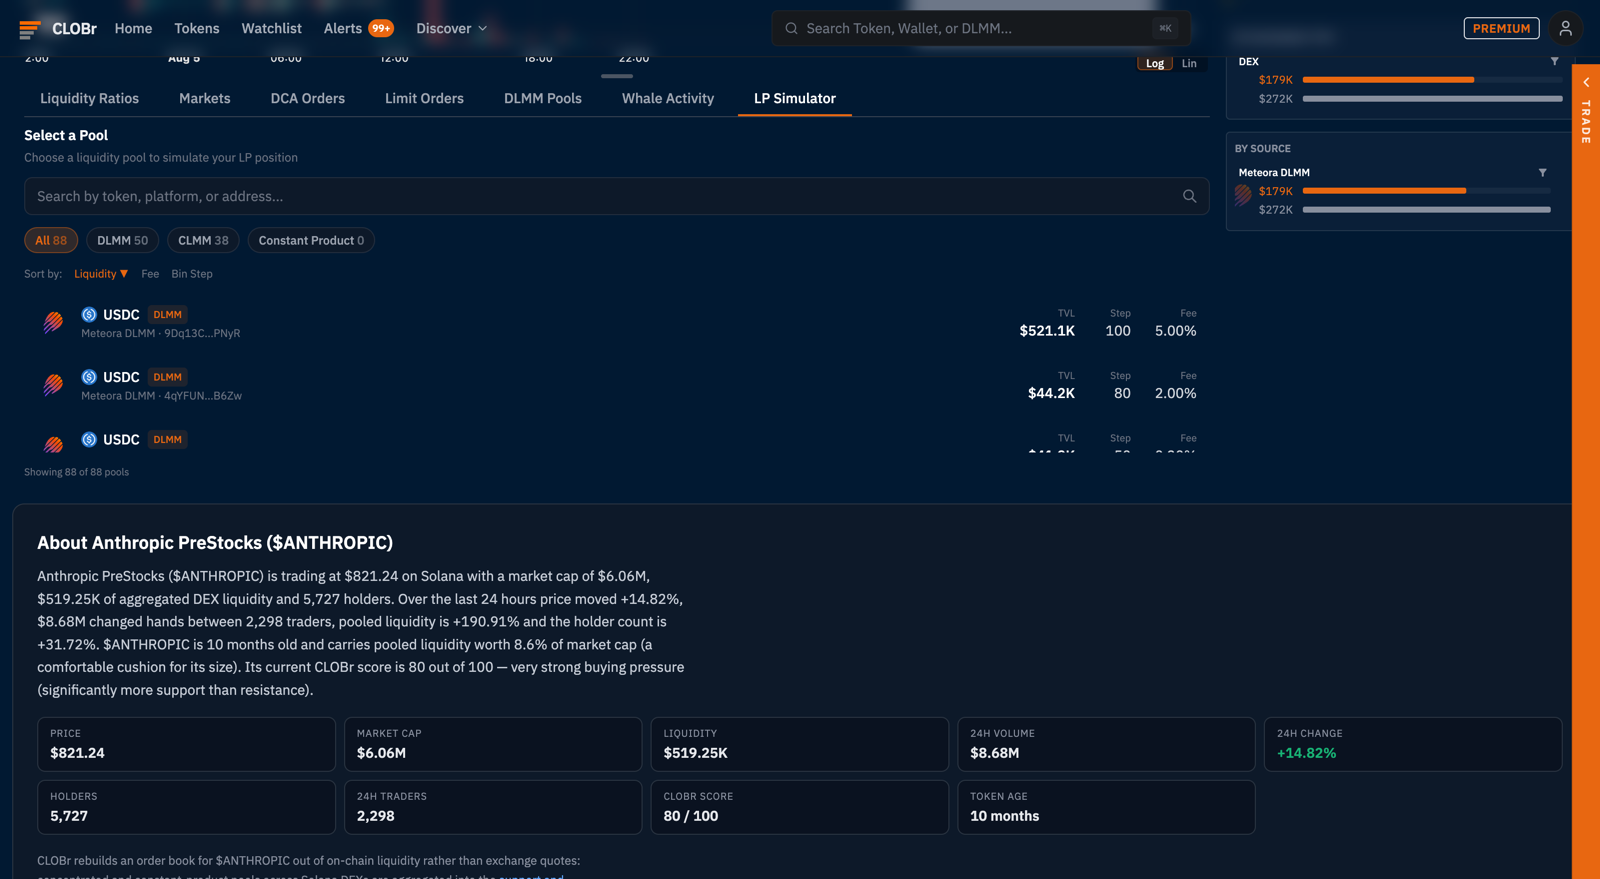
Model an LP position before committing capital: pick one of the token's pools, set deposit amounts and a min/max price range, choose a strategy shape (Spot, Curve, or Bid Ask), and the simulator projects the position against the pool's real liquidity and fee data. Pair it with the Liquidity Ratios matrix: ratios tell you whether the pool pays, the simulator tells you what your range of it would earn.
A reading order that works
Novice: depth chart first (where are the walls?), then Markets (is the liquidity in one pool or spread?). Those two answer "can I get out?" which is the only question that matters on day one.
Intermediate: add DCA Orders and Limit Orders before entries. Scheduled buys stacking under price plus a bid cluster is a floor someone is paying to defend. Scheduled sells over your head are a ceiling with a timer.
Expert: Whale Activity and Liquidity Ratios for positioning ahead of the move: flat price + top-100 accumulation + rising 1H fee density is the pattern of a coiled token. LPs finish in DLMM Pools and the Simulator to get paid for the range they expect.
Quick reference
- Markets: venue-by-venue depth. Exit question.
- DCA Orders: scheduled flow + 24h timeline. Pressure question.
- Limit Orders: resting bids/asks, incl. hidden-price Ultra orders. Wall question.
- DLMM Pools: bin-level liquidity shape. Range question.
- Pools: pool-by-pool depth on Robinhood Chain. Venue question.
- Whale Activity: top-holder tiers x time windows. Conviction question.
- Liquidity Ratios: volume ÷ liquidity matrix. Efficiency question.
- LP Simulator: your range, projected. Payoff question.